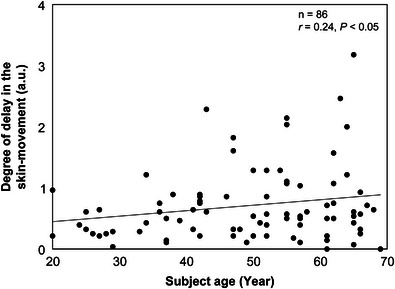
FIGURE 6.

Effect of age on the degree of delay in the cheek skin movement. This graph presents the relationship between the degree of delay on the y‐axis, corresponding to the slope shown in Figure 5, and the age of the models (r = 0.24, p < 0.05). The straight line is the regression line, y = 0.009x + 0.2672, indicating that the degree of delay increases with advancing age.
