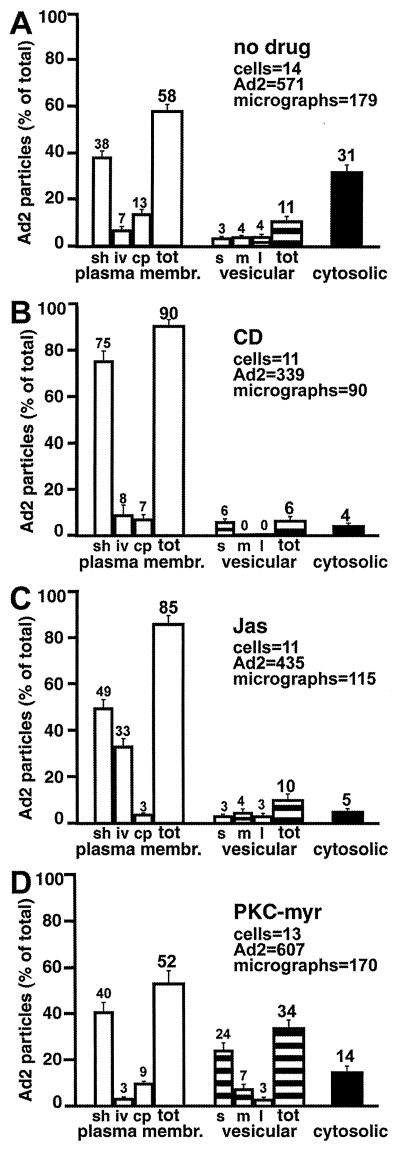
FIG. 6.
Quantification of Ad2 particles at the plasma membrane, in intracellular vesicles, and in the cytoplasm of HeLa cells treated with actin- and PKC-directed drugs or not treated. HeLa cells were infected and analyzed by thin-section EM as in Fig. 5. (A) Control cells. (B) CD-treated cells. (C) Jas-treated cells. (D) PKC-myr-treated cells. Viruses were counted in smooth (sh), invaginated (iv), and coated-pit (cp) regions of the plasma membrane, within small (s), medium (m), or large (l) vesicles, and also in the cytosol (solid bars). The number of Ad particles on the entire plasma membrane (open bars) and within the entire vesicle population (striped bars) is also indicated (tot). Mean values are expressed as the percentage of total virus particles, and the corresponding SEM values are indicated based on the analyzed number of cells (ranging from 11 to 14) and virus particles (ranging from 339 to 607). The corresponding number of electron micrographs (ranging from 90 to 179) is also indicated for each of the conditions.

