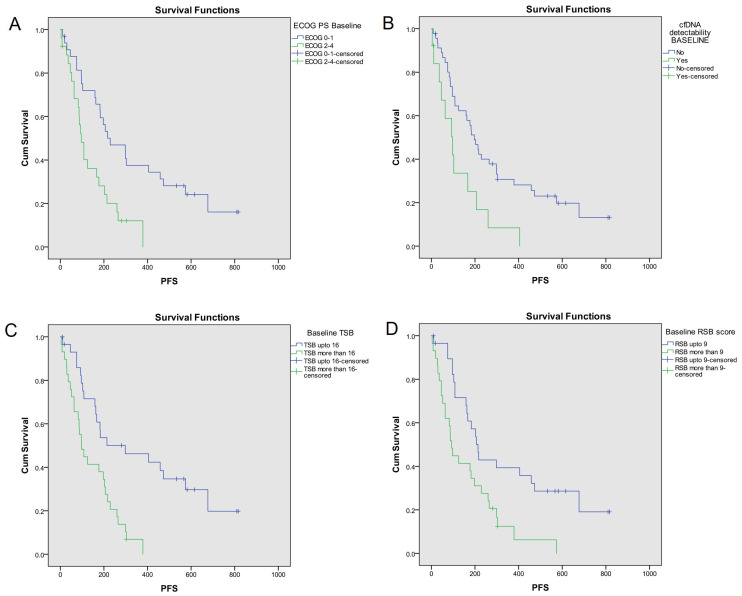
Figure 1.
PFS analysis based on key baseline variables [10]. Probability of PFS (Kaplan-Meier analysis) was significantly higher with (A) ECOG PS 0–1 [229 days (95% CI = 89–369)] as compared to ECOG PS 2–4 [96 days (95% CI = 70–122); log-rank P = 0.002]; (B) no cfDNA detectability [197 days (95% CI = 148–246)] as compared to cfDNA detectability [97 days (95% CI = 40–154); log-rank P = 0.008]; (C) TSB* ≤ 16 [298 days (95% CI = 19–577)] as compared to TSB >16 [97 days (95% CI = 60–134); log-rank P < 0.001]; (D) RSB* ≤ 9 [214 days (95% CI = 170–258)] as compared to RSB > 9 [93 days (95% CI = 74–112); log-rank P = 0.003]. The asterisk (*) indicates that the reference is [10]. CI: confidence interval; PFS: progression-free survival; ECOG: Eastern Co-operative Oncology Group; PS: performance status; cfDNA: cell free DNA; RSB: respiratory symptom burden; TSB: total symptom burden

