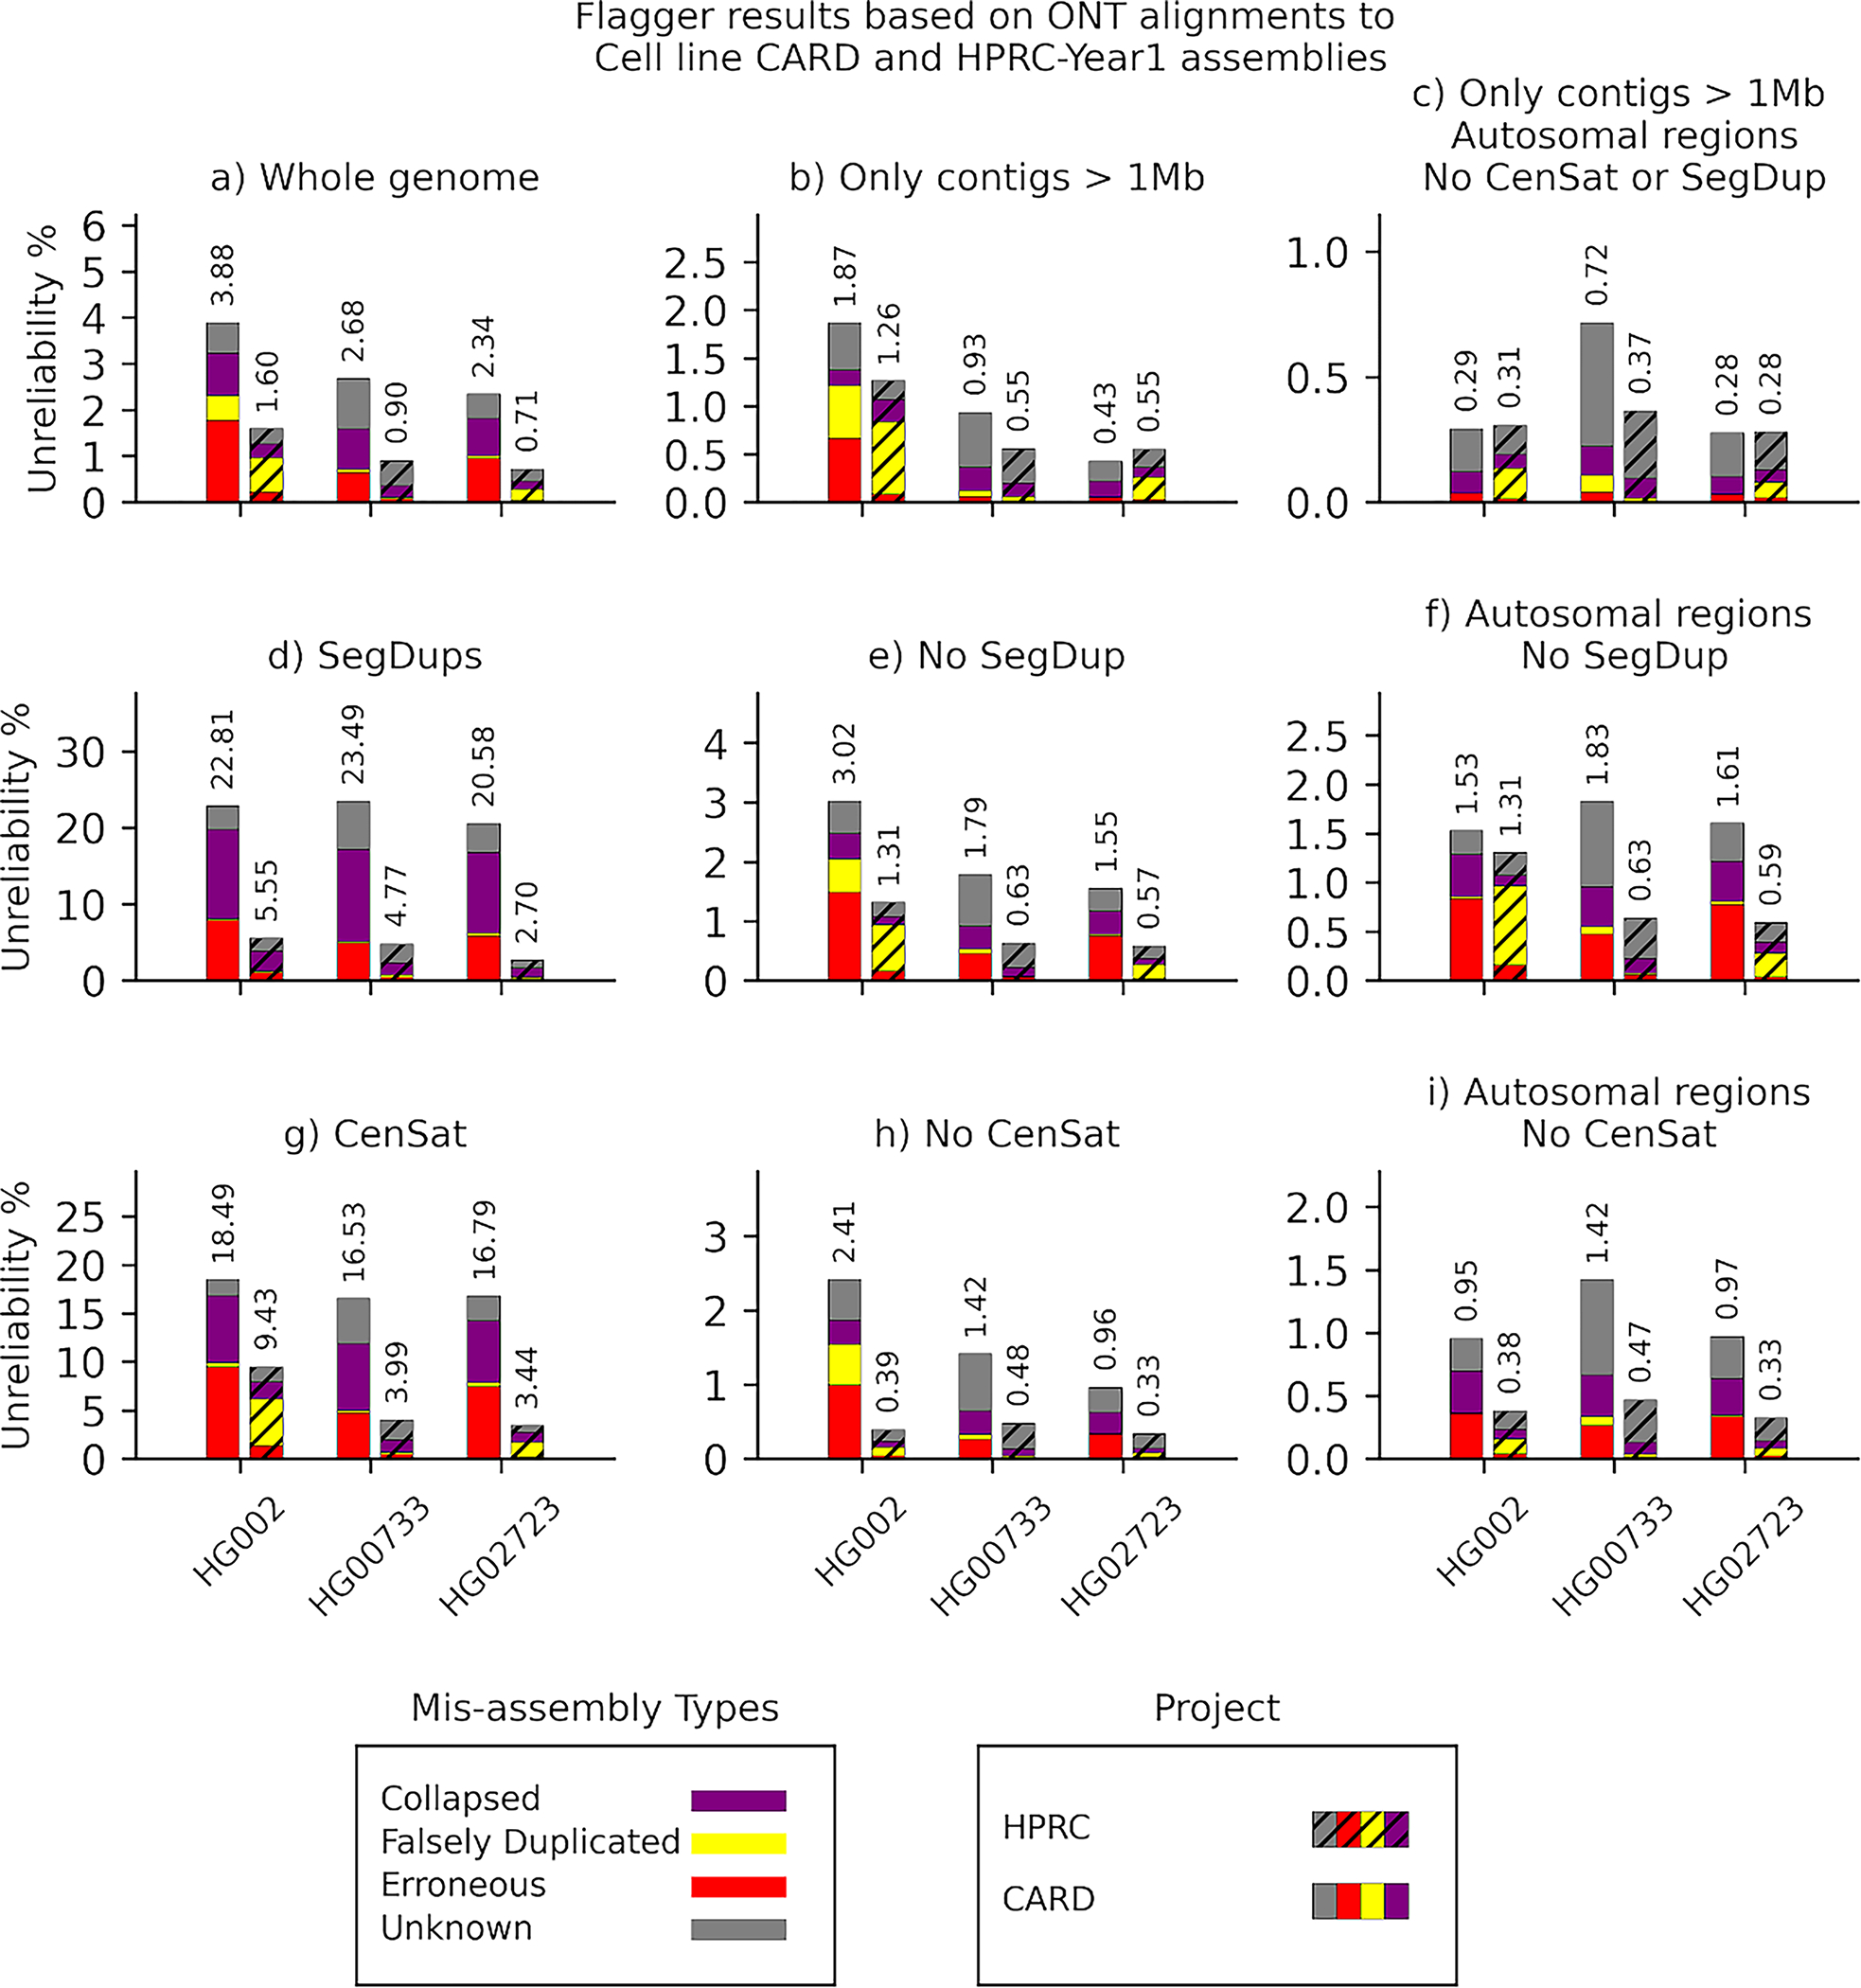
Extended Data Fig. 6. Flagger results based on ONT alignments to cell line CARD and HPRC-Y1 assemblies.

The y-axis of each panel indicates the unreliability percentages which are the total number of bases flagged as misassembly divided by the total assembly length and multiplied by one hundred.
