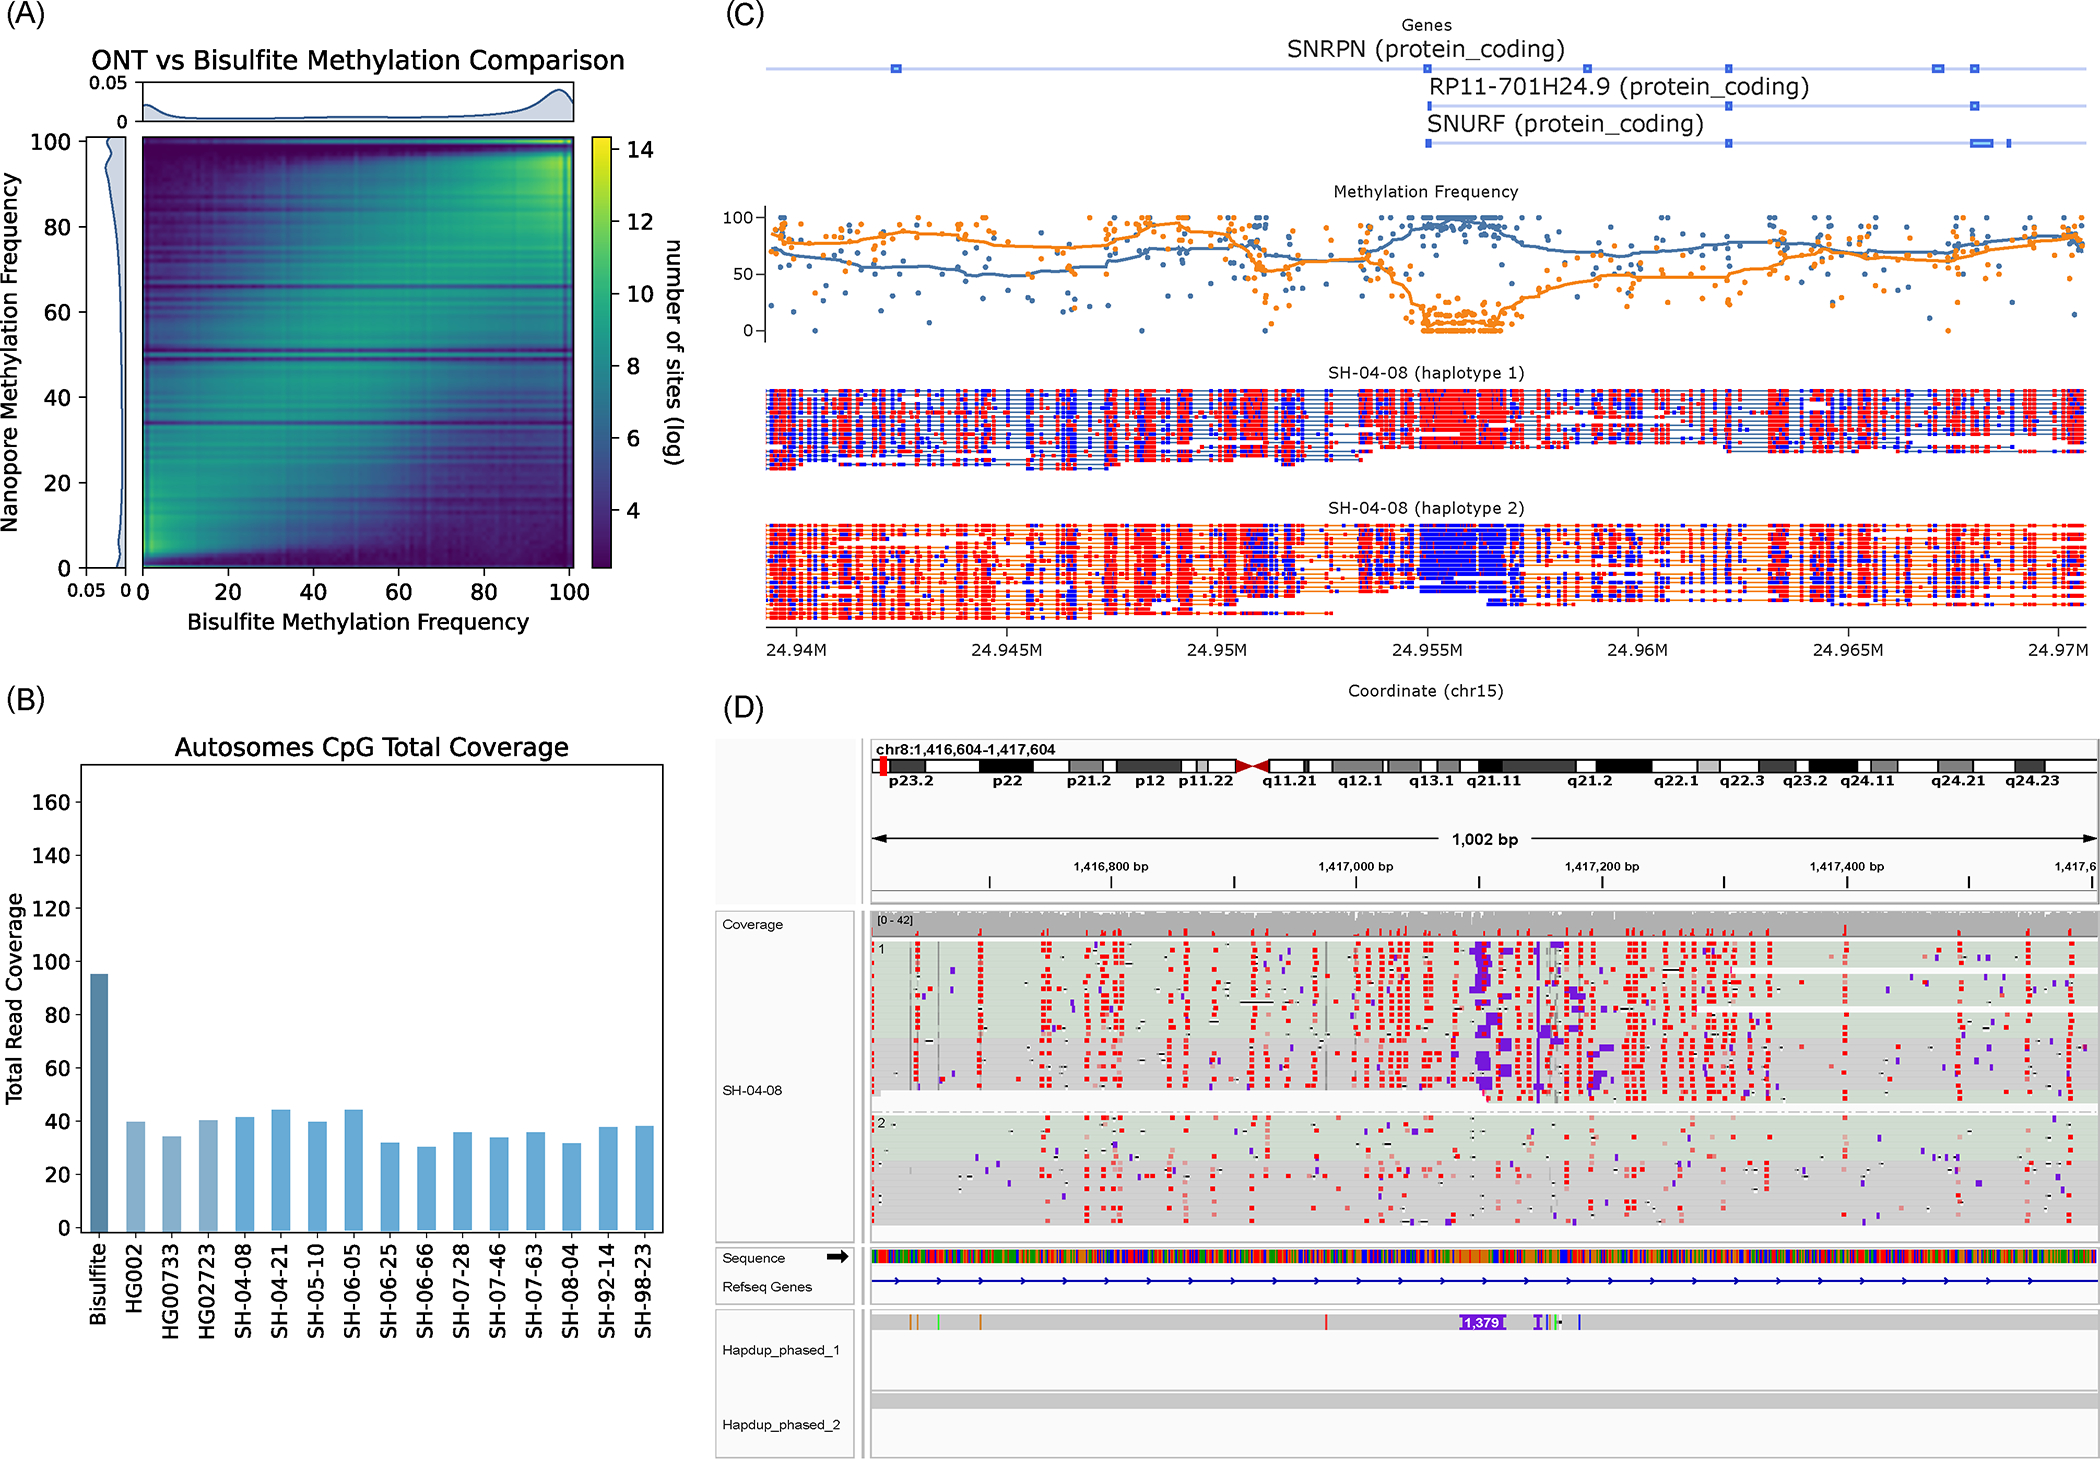
Figure 6. Haplotype-specific methylation profiling.

(A) Heatmap of concordance between Bisulfite whole genome sequencing and ONT Remora Methylation calls in HG002 at sites shared by both technologies covered by at least 5 reads. The lower coverage of ONT data causes striping in the heatmap at specific frequencies. (B) Read depth of Bisulfite and ONT samples. CpG sites are one position apart in the sense and antisense DNA strands due to C-G base pairing. Since this read coverage is counted per CpG location the actual coverage was doubled to account for the neighboring strand locations and estimate actual genome wide coverage. (C) An example of differential methylation pattern in the SNRPN locus in the brain sample SH-04–08. Red CpG sites are methylated and blue sites are unmethylated. Above the reads is a plot of methylation frequency and gene locations, visualized using modbamtools (D) IGV visualization of phased methylated ONT reads and the phased assemblies of brain sample SH-04–08 at the DLGAP2 gene locus that shows a 1,379 base pair insertion that is differentially methylated across haplotypes. Source data is available at Supplementary Table 12.
