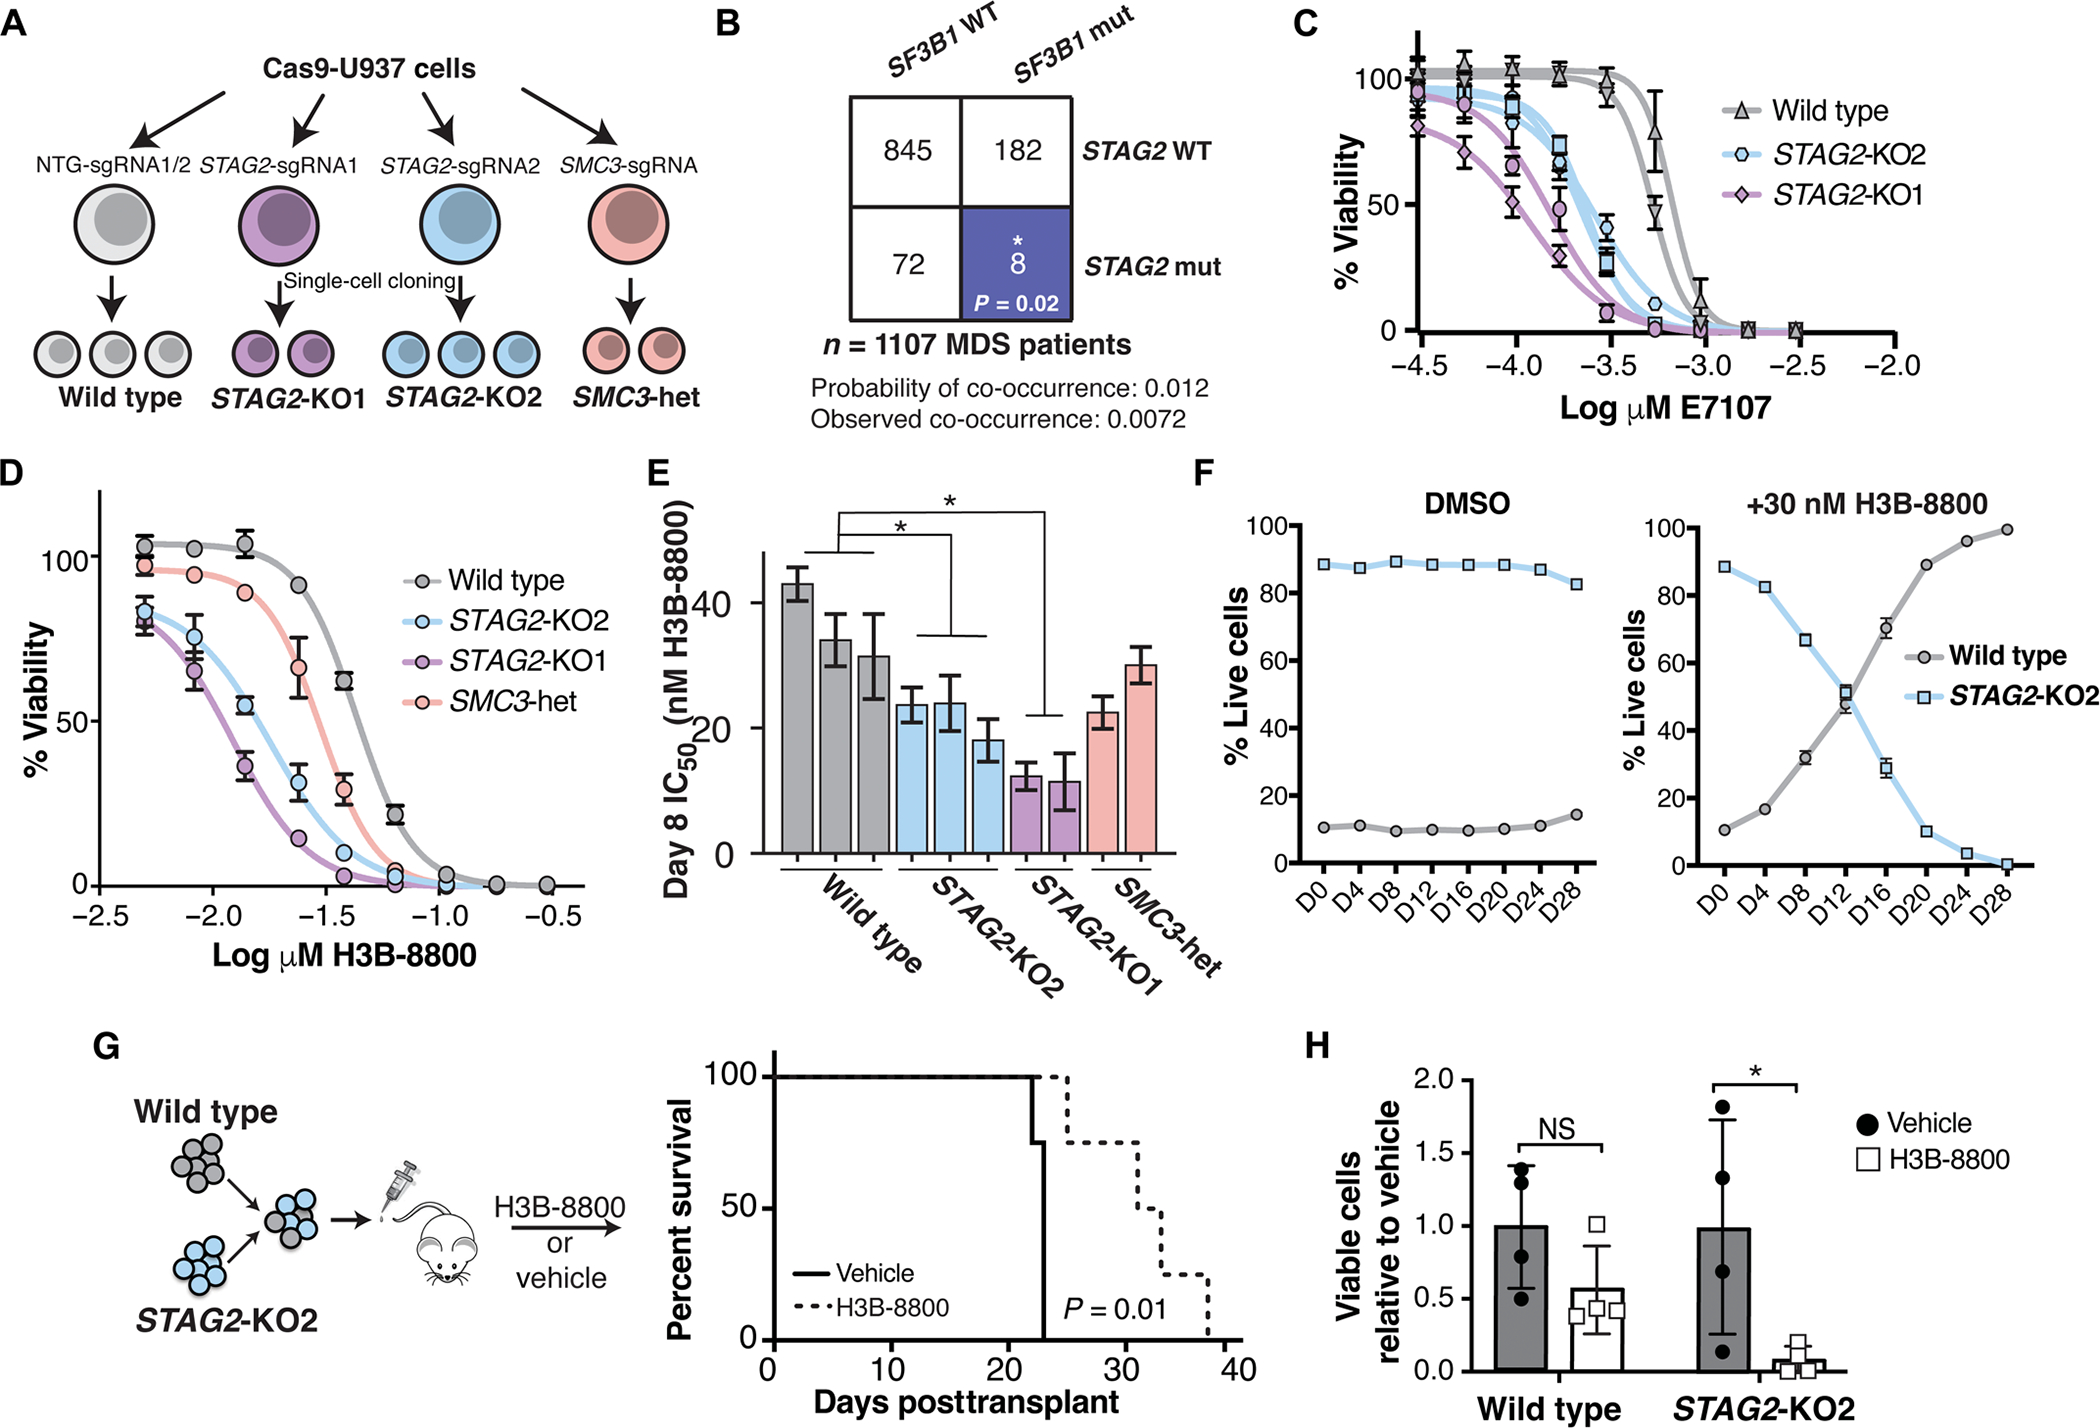
Fig. 1. Cohesin-mutant cells are sensitive to SF3B1-targeting compounds.

(A) Schematic of isogenic AML cell lines used in this study. U937 cells expressing Cas9 were nucleofected with single-guide RNAs (sgRNAs) targeting STAG2, SMC3, or nontargeting (NTG) sgRNAs. Two independent sgRNAs were used for STAG2 (KO1 and KO2) and NTG, and a single sgRNA was used to target SMC3. Independent single-cell–derived clones were used as biological replicates in this study. (B) Co-occurrence of SF3B1 and STAG2 mutations in a cohort of patients with MDS from the Dana-Farber Cancer Institute. Expected and observed probability of co-occurrence is listed. Blue color indicates a significant mutually exclusive relationship between SF3B1 and STAG2 mutations. *P < 0.05 (Z test). WT, wild type; mut, mutant. (C) Drug dose-response curves of E-7107–treated WT and STAG2-KO U937 clones on day 12 of treatment. Error bars represent SD of measurements of three technical replicates. (D) Drug dose-response curves of a representative set of wild-type and cohesin-mutant U937 cells treated with H3B-8800 for 8 days. Error bars represent SD of measurements in technical triplicates. (E) Quantification of IC50 among biological replicates (n = 2 or 3) of wild-type and cohesin-mutant U937 cells on day 8 of treatment with H3B-8800 tested in technical triplicates. STAG2-KO1 and STAG2-KO2 clones have a significantly lower IC50 than wild-type cells with H3B-8800 treatment (Kruskal-Wallis with post hoc test, P = 0.05). Error bars represent the 95% confidence interval of the IC50 calculated from technical triplicates of each cell line. (F) Competition assay with wild-type (mCherry) and STAG2-KO2 (GFP) U937 cells mixed in a 1:10 ratio in the presence of DMSO or H3B-8800 (30 nM) in vitro. % Live GFP+ or mcherry+ cells were determined using flow cytometry. error bars represent Sd of measurements of technical triplicates. (G) Schematic of the in vivo drug treatment of NSGS mice injected with wild-type (mcherry) and STAG2-Ko2 (GFP+) U937 cells mixed in a 1:1 ratio. Treatment with h3B-8800 or vehicle control was started 7 days posttransplant. Kaplan-Meier survival analysis was performed; P = 0.01. n = 4 mice per group. (H) leukemia burden in mice treated with h3B-8800 or vehicle was assessed in the spleens of animals at the time of sacrifice. % Live GFP+ or mcherry+ cells were determined using flow cytometry. Mean ± Sd is shown. P < 0.05 (Student’s t test). n = 4 mice per group.
