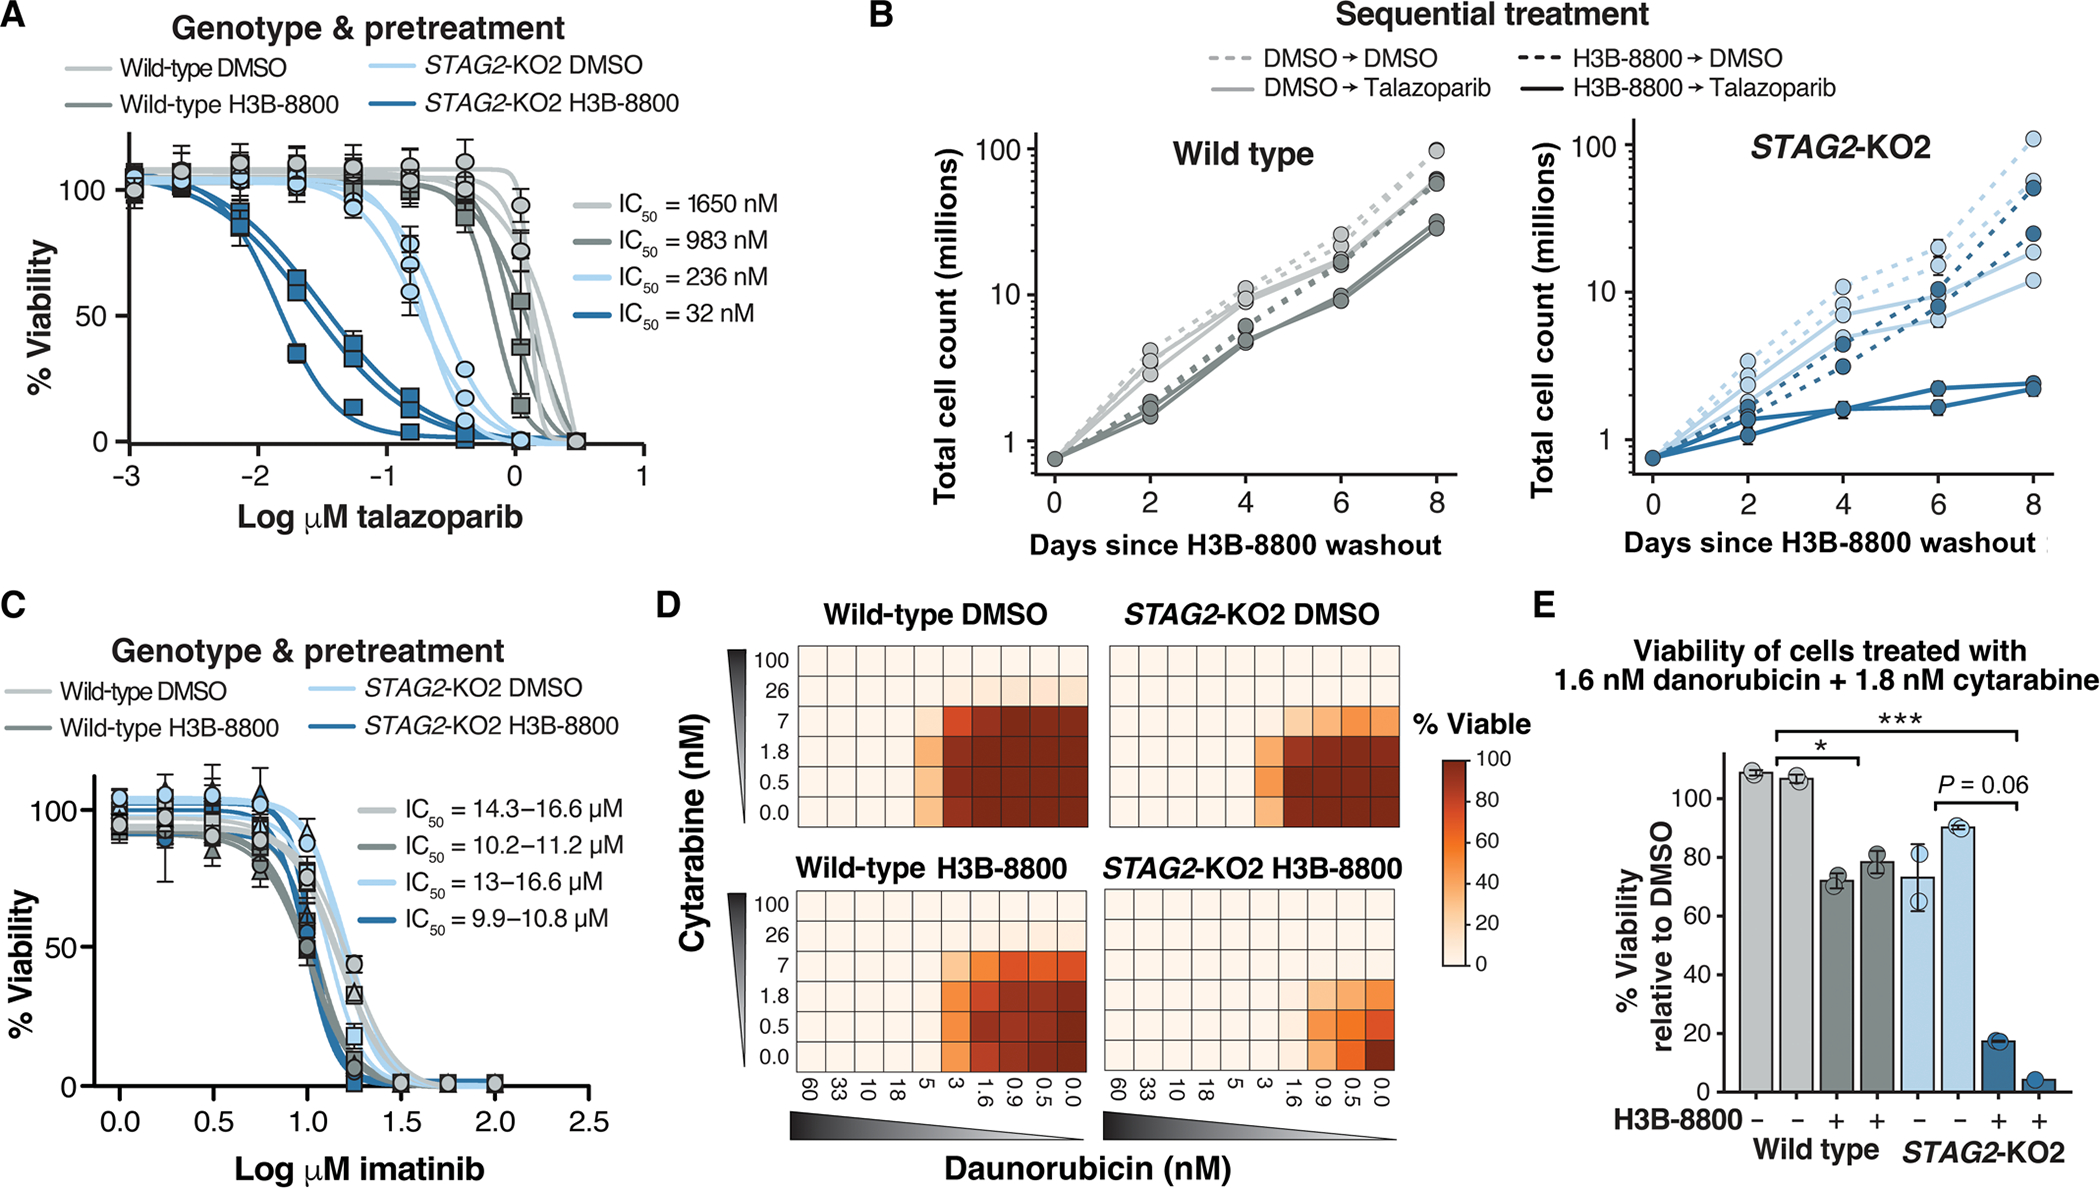
Fig. 4. Splicing modulation sensitizes cohesin-mutant AML cell lines to killing by talazoparib and chemotherapy.

(A) drug dose-response curves of wild-type and STAG2-KO2 cells pretreated with 50 nM H3B-8800 or DMSO for 3 days, followed by drug washout and 8 days of treatment with talazoparib. error bars represent Sd of technical triplicate measurements for each biological triplicate sample (n = 3 per genotype and condition). (B) Growth curves depicting total number of wild type (left) or STAG2-KO2 cells (right) pretreated with DMSO or H3B-8800 (50 nM) for 3 days, followed by treatment with talazoparib (50 nM) or DMSO for 8 days. error bars represent Sd of technical duplicate measurements for each biological replicate sample (n = 2 per genotype and condition). (C) drug dose-response curves of wild-type and STAG2-KO2 cells pretreated with 50 nM H3B-8800 or DMSO for 3 days, followed by drug washout and 8 days of treatment with imatinib. error bars represent SD of technical triplicate measurements for each biological replicate sample (n = 2 per genotype and condition). (D) heatmap of cell viabilities for wild-type and STAG2-KO2 cells pretreated with DMSO (top) or 50 nM H3B-8800 (bottom) for 3 days, followed by treatment with a combination of daunorubicin and cytarabine for 8 days. cell viabilities are normalized to DMSO-treated controls on each plate (0 nM cytarabine and 0 nM daunorubicin). Values shown are the average of two technical replicate samples for one representative biological replicate sample. (E) Bar plot of percent viable cells after combination treatment with 1.6 nM daunorubicin and 1.8 nM cytarabine relative to DMSO-treated controls. cells received either 3 days of 50 nM H3B-8800 (dark bars) or DMSO control (light bars) before chemotherapy. data points show technical replicates n = 2 per condition (except biological replicate 2 of H3B-8800 treated STAG2-KO2 cells n = 1). each bar represents an independent biological replicate sample. P = 0.008 (Kruskal-Wallis), *P < 0.05, ***P < 0.001 in post hoc analysis using the Dunn’s test.
