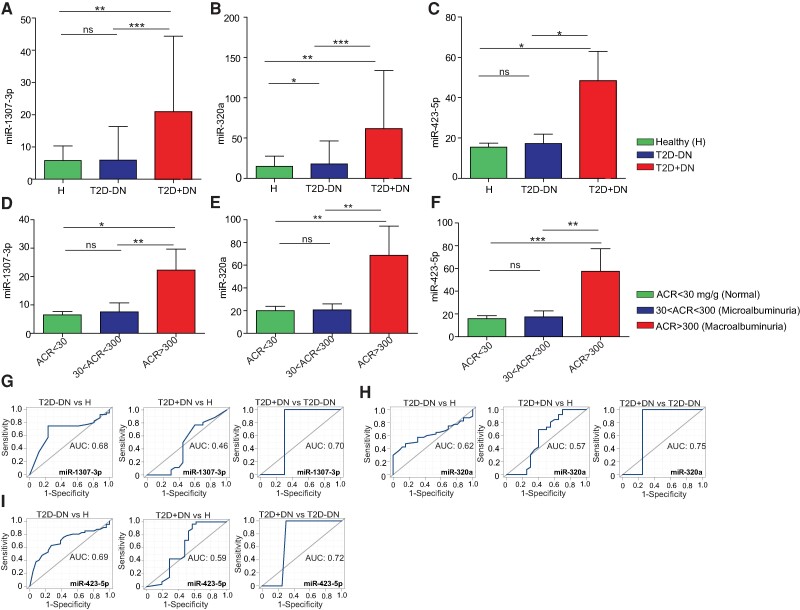
Figure 3.
Expression profile of differentially expressed miRNAs among T2D − DN and T2D + DN. (A-C) Expression of differentially expressed miRNAs miR-1307, miR-320a, and miR-423-5p by signal values between healthy, type 2 diabetes without nephropathy (T2D − DN) and type 2 diabetes with nephropathy (T2D + DN) patients. (D-F) Box plot shows the expression of differentially expressed miRNAs (miR-1307, miR-320a, and miR-423-5p) by signal values between T2D + DN and T2D − DN patients with normal individual (ACR < 30 mg/g), microalbuminuria (30 < ACR < 300), and macroalbuminuria (ACR > 300 mg/g). (G-I) ROC curves for miR-1307, miR-320a, and miR-423-5p of T2D − DN vs heathy, T2D + DN vs healthy, and T2D + DN vs T2D − DN. The area under the ROC curve (AUC) represents the accuracy of the miR-1307, miR-320a, and miR-423-5p biomarkers in T2D − DN and T2D + DN. *indicates P < .05, **indicates P < .01, ***indicates P < .001 and “ns” indicates not significant.

