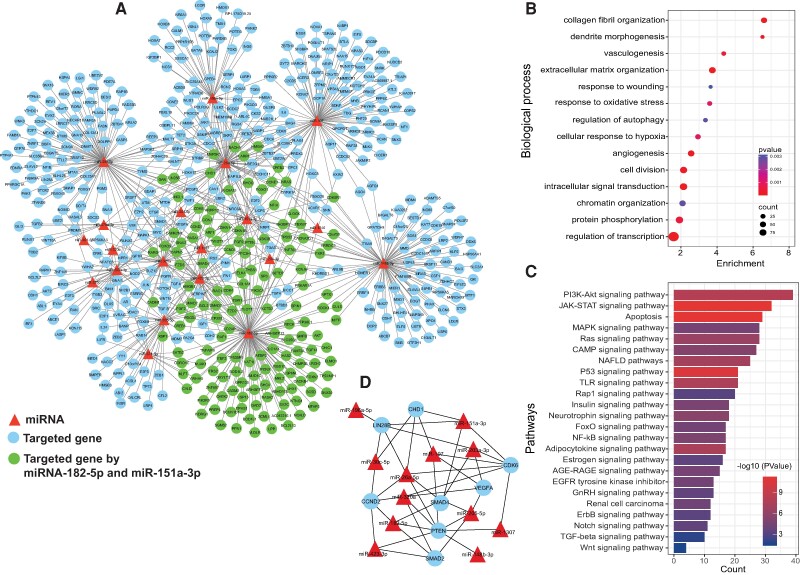
Figure 4.
Prediction of target genes of ECV miRNAs, functions, and pathways of differentially expressed miRNAs. (A) mRNA-miRNA target interaction network obtained from a list of shared DE-miRNAs among type 2 diabetes with nephropathy (T2D + DN) and type 2 diabetes without nephropathy (T2D − DN). The network contains the significant T2D + DN and T2D − DN related miRNA-mRNA target interactions network retrieved from MIENTURNET. The miRNA is represented by red triangular shape nodes and mRNA by cyan color circular shape nodes; the green color nodes are genes targeted by prognostic miR (miR-151a and miR-182-5p) (B) Significant enriched biological process of shared DE-miRNA in T2D + DN and T2D − DN. Dot size indicates count. Count represents the number of genes associated with each pathway. Dot color denotes the P values of pathways and x-axis represent fold enrichment. (C) Bar plot of significant biological pathways of predicted genes of shared DE-miRNA in T2D + DN and T2D − DN patients. X-axes represent count of genes with significance (P < .05) indicated by order and color trend. (D) mRNA-miRNA core network module of driver genes and key DE-miRNAs.

