
FIGURE 2.
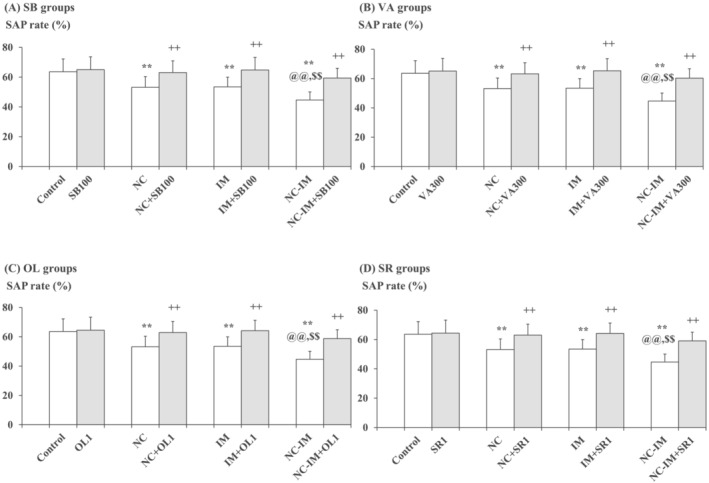
Mitigating effects of the HDAC inhibitors, TRPV1 agonist, or CB1 antagonist against working memory impairment‐like behaviours. The parameter values of the Y‐maze test (SAP rates) at the 2‐h time point after the last NC (0.8 mg/kg, sc) and/or IM (10 min) treatment are shown as means with SD bars (n = 10) for each HDAC inhibitor (SB or VA), TRPV1 agonist (OL), or CB1 antagonist (SR) cotreatment group (with each ip dose [mg/kg]), and statistical significance in post hoc tests is denoted using the symbols as defined below. The detailed data and statistical results have been included in Table S2. (A) SB (100 mg/kg, ip) cotreatment groups (SB groups); (B) VA (300 mg/kg, ip) cotreatment groups (VA groups); (C) OL (1 mg/kg, ip) cotreatment groups (OL groups); (D) SR (1 mg/kg, ip) cotreatment groups (SR groups). **P < 0.01: significant attenuation as compared with the control group; ++P < 0.01: significant increase as compared with the NC, IM, or NC‐IM group without any cotreatments; @@P < 0.01: significant attenuation as compared with the NC group without any cotreatments; $$P < 0.01: significant attenuation as compared with the IM group without any cotreatments.