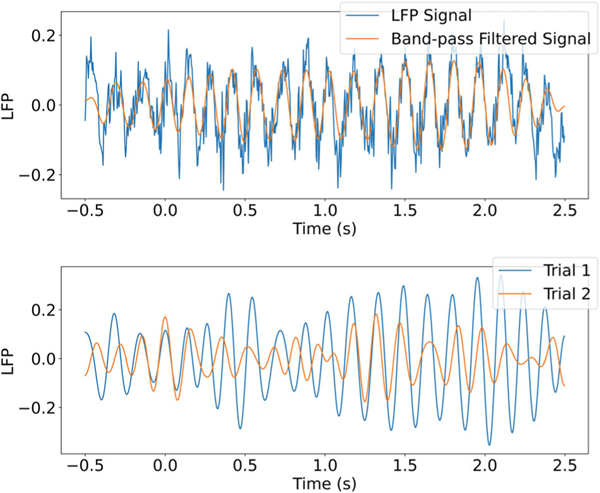
Figure 1:
Three seconds of local field potential (LFP) data filtered at 6.5Hz with a window from 6 to 7Hz. In the top figure, we plot both the raw LFP signal, which consists of a noisy oscillation around 6.5Hz, and the filtered signal, which removes the noise. In the bottom figure, we plot filtered data from the same electrode across two trials. At many points in time, the two trials have different phases or amplitudes.

