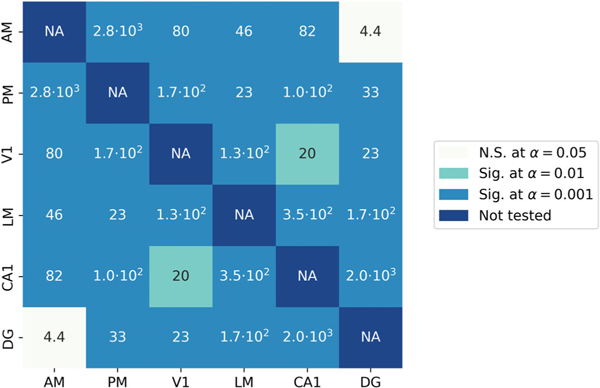
Figure 5:
Results of parametric bootstrap test performed on all pairs of regions to test if a significant conditional correlation exists between each pair of areas. Numbers inside the boxes are likelihood ratio statistics testing the hypothesis that . The colour of each box represents the results of significance tests for three values of , the false-positive rate, where each significance test is done with a Bonferroni correction for multiple comparisons. The level is the smallest we are able to test given our simulation settings. The likelihood ratio values indicate that some pairs would be significant at much smaller values of . There are significant partial correlations between most pairs of areas at , except between DG and AM as well as between V1 and CA1.

