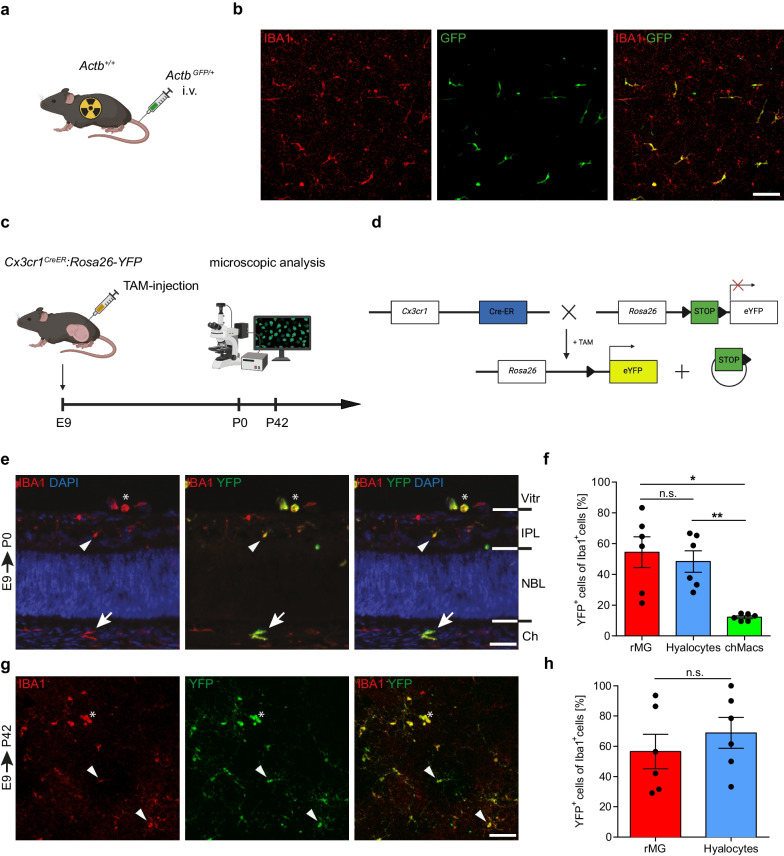
Fig. 3.
Embryonic pulse labeling reveals a prenatal origin of murine hyalocytes. a Schematic of bone marrow chimera creation. Wildtype mice (Actb+/+) were whole-body irradiated and reconstituted intravenously (i.v.). with bone marrow of ActbGFP/+ mice. b Images of retinal flat mounts of ActbGFP/+:Actb+/+ bone marrow chimeras. GFP+ donor-derived hyalocytes are present in the vitreous. Images are representative for three mice. Scale bar = 100 µm. c Schematic of embryonic pulse labeling experiment. Cx3cr1CreER:Rosa26-YFP mice were injected with tamoxifen (TAM) at embryonic day (E) 9 and analyzed at postnatal day (P) 0 or P42. d Illustration of embryonic pulse labeling approach. TAM administration activates inducible Cre-recombinase which irreversibly removes a LoxP-site-flanked STOP-sequence in Cx3cr1-expressing cells, causing consistent YFP-expression and labeling CX3CR1+ cells and their progeny. e Images of E9.0-labeled hyalocytes (asterisk), rMG (arrowhead) and choroidal macrophages (chMacs) (arrow) in a cryosection from Cx3cr1CreER:Rosa26-YFP mice at P0. Images are representative for six mice from three independent experiments. Scale bar = 50 µm. Vitr—vitreous, IPL—inner plexiform layer, NBL—neuroblast layer, Ch—choroid. f Quantification of YFP+ cells among IBA1+ hyalocytes, rMG and chMacs in E9.0-labeled Cx3cr1CreER:Rosa26-YFP mice at P0. Graphs depict mean S.E.M for six mice from three independent experiments. Statistics: one-way repeated measure ANOVA with post-hoc Tukey’s multiple-comparison test (* p < 0.05, ** p < 0.01). g Images of retinal flat mounts depicting E9.0-labeled hyalocytes (asterisk) and rMG (arrowheads) from Cx3cr1CreER:Rosa26-YFP mice at P42. Images are representative for six mice. Scale bar = 50 µm. h Percentage of YFP+ cells among IBA1+ hyalocytes and rMG in E9.0-labeled Cx3cr1CreER:Rosa26-YFP mice at P42. Graphs depict mean S.E.M for six mice. Statistics: paired t-test (n.s., p > 0.05)

