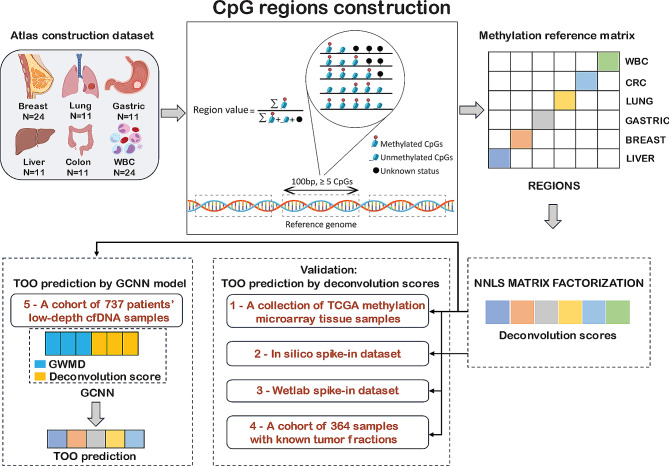
Fig. 1.
Schematic overview of this study. We first constructed a tumor-specific methylation atlas (TSMA) using a WGBS dataset (Atlas construction dataset) of 64 tumor tissues comprising five cancer types (breast, colorectal, gastric, liver and lung cancer) and paired white blood cells (WBC). The methylation signals from WGBS data (region value) were calculated for approximately 1.1 million pre-defined CpG regions (regions of 100 bp in length covering at least 5 CpG sites). This large matrix of region values was then used to construct the TSMA, comprising of 2,945 differential regions between five tumor-tissue types and WBC across the entire genome. With the TSMA, deconvolution scores for new input samples were calculated using a non-negative least square (NNLS) matrix factorization. We next validated the use of TSMA and deconvolution scores in 3 datasets, including Dataset 1: tumor tissue methylation microarray data from TCGA, Dataset 2: in silico spike-in samples with known amount of tissue DNA fragments and Dataset 3: wet lab spike-in samples with known amount of tissue DNA fragments. Finally, we implemented a graph convolutional neural network combining deconvolution scores and genome-wide methylation density (GWMD). The model was trained and validated on a cohort of 737 low-depth WGBS cfDNA samples (Dataset 4)

