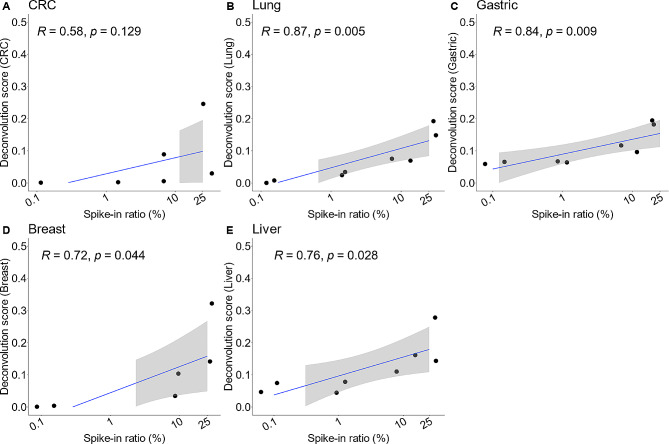
Fig. 4.
Correlation between deconvolution scores and the proportion of cancer tissue fragments in wet-lab spike-in samples. Strong correlation between spike-in ratios and deconvolution scores was observed in (A) CRC, (B) Lung, (C) Gastric, (D) Breast, and (E) Liver cancer. Wet-lab spike-in samples were generated by mixing genomic DNA from each tumor tissue type with cfDNA from 2 healthy donors at four ratios (0.1%, 1%, 10%, and 25%), before WGBS and calculating deconvolution scores (2 replicates at each ratio). Correlation was measured by Pearson coefficient  . Values on x-axis were log-scaled for visualization purpose only. The 95% CI (gray shading region) is not available at spike-in tumor fraction of less than 1% because all deconvolution scores are zero

