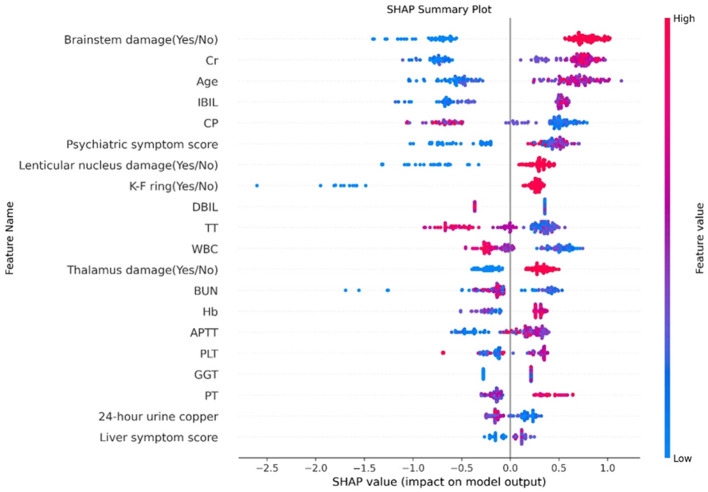
Figure 4.
Feature analysis results. The abscissa represents the weight of the influence, instead of the specific value of the feature; the influence of feature value size on the results is represented by color (red represents a large value, blue represents a small value, and purple is adjacent to the mean). Cr, creatinine; IBIL, indirect bilirubin; CP, ceruloplasmin; DBIL, direct bilirubin; TT, thrombin time; WBC, white blood cell; BUN, blood urea nitrogen; Hb, hemoglobin; APTT, activated partial thromboplastin time; PLT, platelet count; GGT, γ-Glutamyl Transferase; PT, prothrombin time.

