
Figure 2.
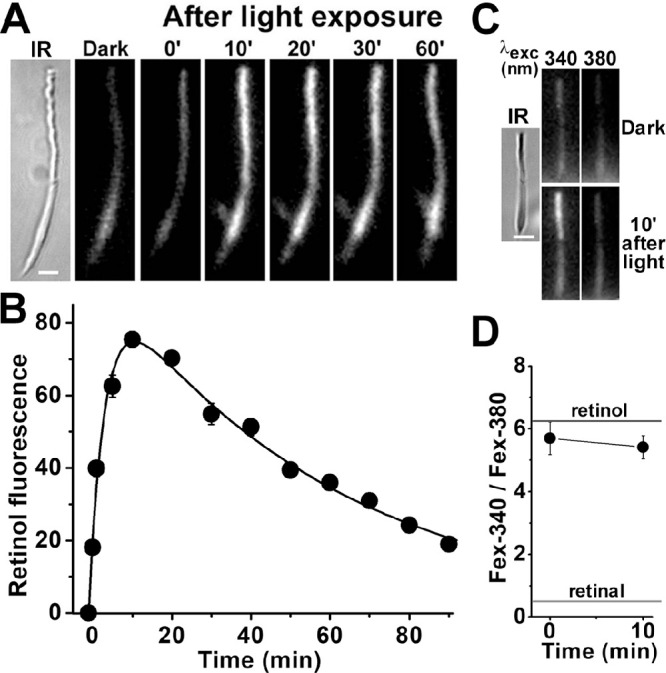
Kinetics of all-trans retinol formation in isolated human rod photoreceptors. (A) Increase in rod outer segment fluorescence after rhodopsin bleaching. IR, infrared image of a rod photoreceptor isolated from a human donor retina (age 80 years); fluorescence (excitation, 360 nm; emission, >420 nm) images of the cell were acquired before (dark) and at different times after bleaching. All fluorescence images are shown at the same intensity scaling. Scale bar: 5 µm. (B) Kinetics of the fluorescence appearing after bleaching of rhodopsin in the outer segments of human rod photoreceptors (n = 7; donor age 80 years). Bleaching was carried out between t = −1 and 0 minute. Error bars represent standard errors. All experiments were conducted at 37°C. The solid line is a least-squares fit according to Equation 2, giving a rate constant for the rise in fluorescence of 0.25 ± 0.02 min–1. (C) Excitation of outer segment fluorescence with 340-nm and 380-nm light (emission, >420 nm). IR, infrared image of a human rod photoreceptor (donor age 76 years); fluorescence images of the cell were acquired before (dark) and at 10 minutes after bleaching of rhodopsin. Images are shown at the same intensity scaling to facilitate comparisons. Scale bar: 5 µm. (D) Ratio of the intensities of the fluorescence excited by 340-nm (Fex-340) and 380-nm (Fex-380) light in human rod outer segments (n = 8; donor age 76 years) after rhodopsin bleaching. Bleaching was carried out between t = −1 and 0 minute. Error bars represent standard errors. The fluorescence intensity ratios determined for all-trans retinal and all-trans retinol (Supplementary Fig. S1) are also shown. All experiments were conducted at 37°C.