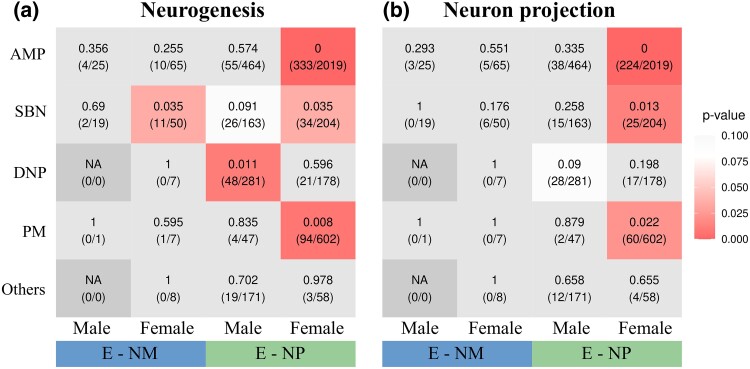
Fig. 3.
Over-representation of differentially expressed genes (DEGs) in neural rewiring functions. Over-representation in a) neurogenesis and b) neuron projection functions for DEGs from 5 brain regions and based on comparisons between E versus NM and E versus NP for each gender. The numbers within each cell indicate the P-values of over-representation analysis (upper values) and the number of DEGs belonging to the respective functional category/the total number of DEGs in each brain region and treatment (values within brackets).

