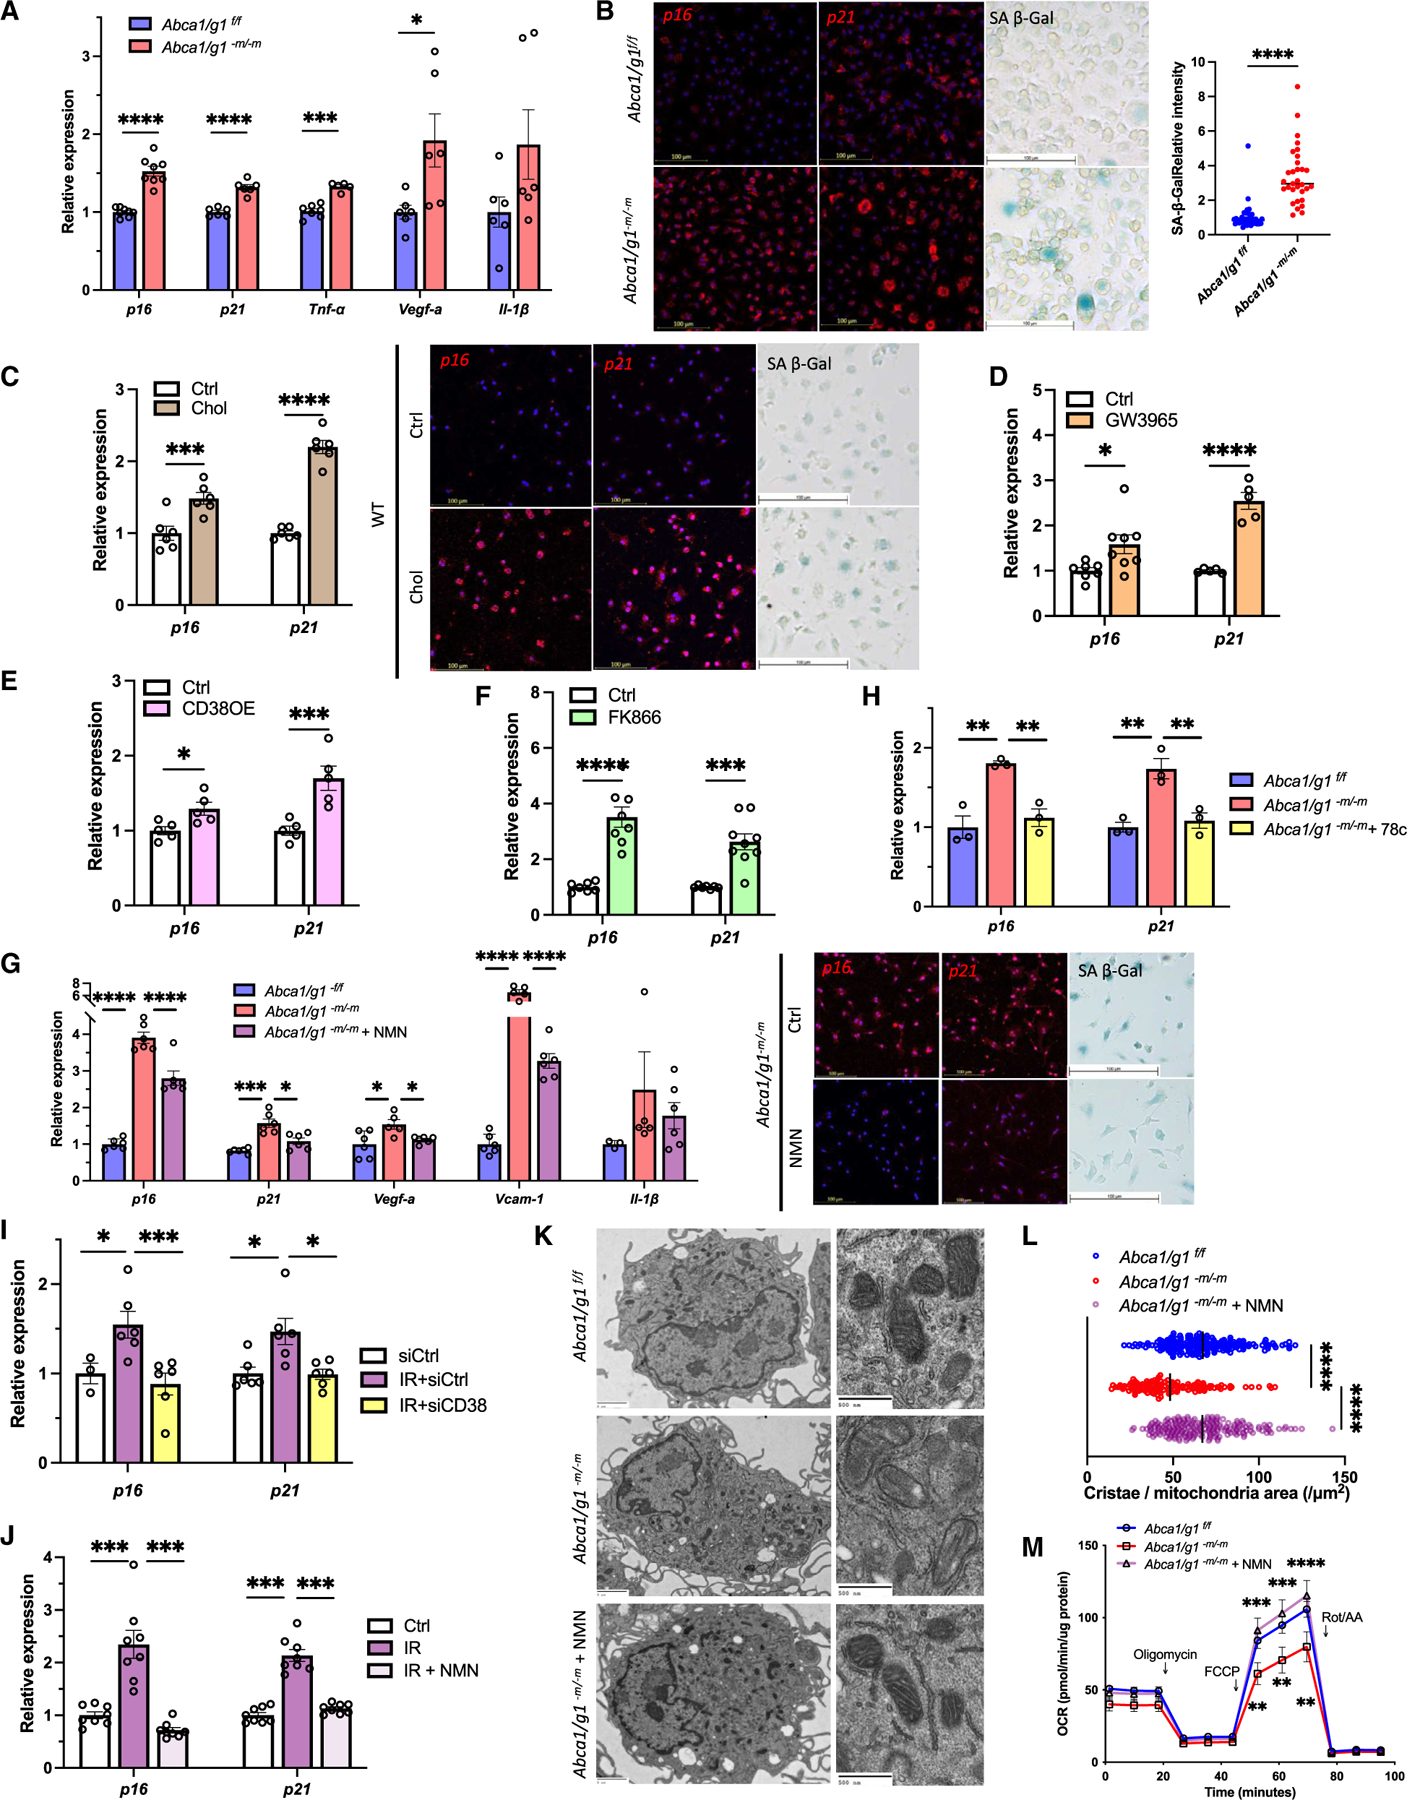
Figure 2. Reduced NAD+ availability induces macrophage senescence and dysfunction.

(A) mRNA expression of senescence markers (p16 and p21) and SASP factors (Tnf-α, Vegf-a, and Il-1β) in BMDMs isolated from Abca1/g1f/f and Abca1/g1-m/-m.
(B) Images of in situ hybridization (ISH; p16 and p21) and SA-β-Gal staining and the quantification of SA-β-Gal.
(C) mRNA expression and ISH of p16 and p21, and SA-β-Gal staining of WT BMDMs treated with cholesterol.
(D–F) (D) mRNA expression of p16 and p21 in WT BMDMs treated with an LXR agonist (GW3965), (E) CD38-overexpression, and (F) a selective NAMPT inhibitor (FK866).
(G) mRNA expression of senescence markers (p16 and p21) and SASP factors (Vegf-a, Vcam1, and Il-1β), representative images of ISH (p16 and p21), and SA-β-Gal staining of Abca1/g1-m/-m BMDMs treated with NMN.
(H) mRNA expression of p16 and p21 in Abca1/g1-m/-m BMDMs treated with the CD38 inhibitor (78c).
(J) (I and J) (I) mRNA expression of p16 and p21 in irradiation-induced senescent BMDMs transfected with siCD38 and (J) treated with NMN.
(K and L) (K) Representative EM images and (L) the quantification of the number of cristae in Abca1/g1f/f and Abca1/g1-m/-m BMDMs treated with or without NMN.
(M) Seahorse assay evaluating the oxygen consumption rate (OCR) of BMDMs. *p < 0.05; **p < 0.01; ***p < 0.001; ****p < 0.0001, t test for comparison between two groups, one-way ANOVA followed by Bonferroni correction for multiple comparison, and two-way ANOVA followed by Bonferroni correction for comparison with multiple time points. Data are represented as mean ± SEM. The length of scale bar is indicated in each image. See also Figure S2.
