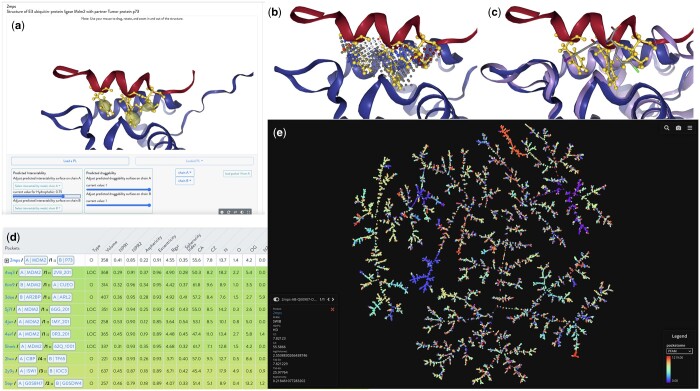
Figure 1.
Visualization of the PDB code 2mps (HD) results from PIE in the iPPI-DB database. (a) Visualization of p53/MDM2 (pdb code 2mps) in the NGL javascript window. (b) VolSite pocket is presented as a negative image of the binding site. (c) Overlay onto the MDM2/p53 complex structures all available ligands for MDM2. (d) table beneath the GUI lists all identified neighboring pockets using PSI metrics. (e) showcases the full PPI pocketome visualization as a minimum spanning tree.

