Figure 2.
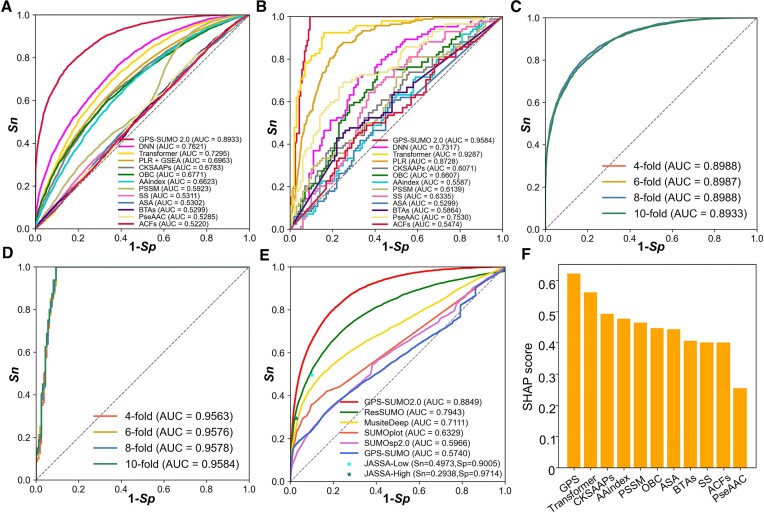
Performance evaluation and comparison of GPS-SUMO 2.0. (A) The performance evaluation of the predictors of SUMOylation sites using various algorithms and features. The ROC curves and AUC values were separately presented for 13 predictive models. The GPS-SUMO 2.0 predictor was trained using 3 machine learning methods and 11 features. The PLR + GSEA model was constructed by PLR training and GSEA finetuning with the GPS feature. The other 11 models was individually trained by using DNN algorithm and single feature. (B) The performance measurement of SIM predictors utilizing different machine learning methods and features. The ROC curves were illustrated and AUC values were calculated for each predictive model. (C) The performance evaluation of SUMOylation predictor using n-fold cross-validations. For the evaluation of predictive models, 4-, 6-, 8-, 10-fold cross-validations were used, and the ROC curves and AUC values were presented. (D) The 4-, 6-, 8-, 10-fold cross-validations were utilized to evaluate the performance of constructed model for the prediction of SIMs. (E) The performance comparison between GPS-SUMO 2.0 and other existing predictors, including ResSUMO, MusiteDeep, SUMOplot, SUMOsp 2.0, GPS-SUMO and JASSA. (F) The evaluation of 11 types of features contributing to GPS-SUMO 2.0 by measuring the SHAP score for each feature.

