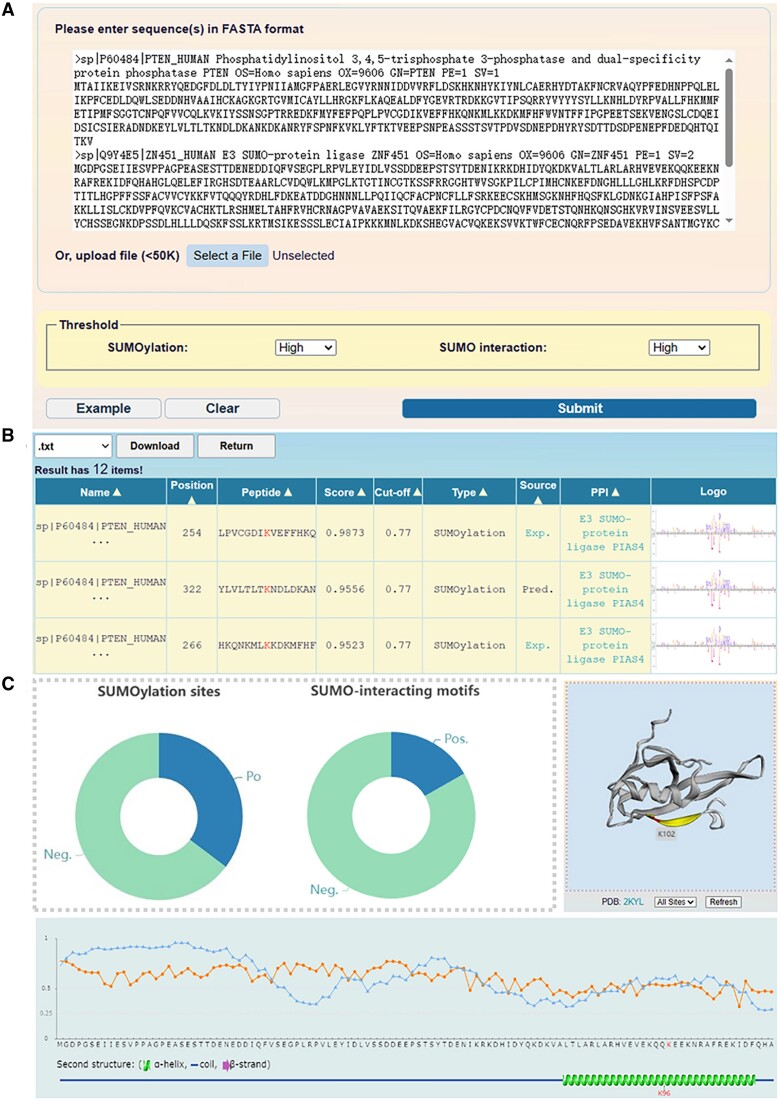
Figure 3.
The usage of the GPS-SUMO 2.0 web server. (A) The interface of sequence submission. The users can input the protein sequence in FASTA format or enter UniProt accession number, and select 3 different thresholds for the prediction of modification sites and SIMs. (B) The presentation of prediction results of the example. In tabular list, the predictive results contain the position of SUMOylation site or SIMs, the prediction score, cut-off value, identification by experimental or computational method, and PPI information. (C) The comprehensive annotations of the prediction results. The number of SUMO modification sites and SIMs predicted by GPS-SUMO 2.0 were presented, the location of SUMOylation sites were illustrated in 3D structure derived from PDB database, the ASA score and disorder score of SUMOylation sites were calculated.

