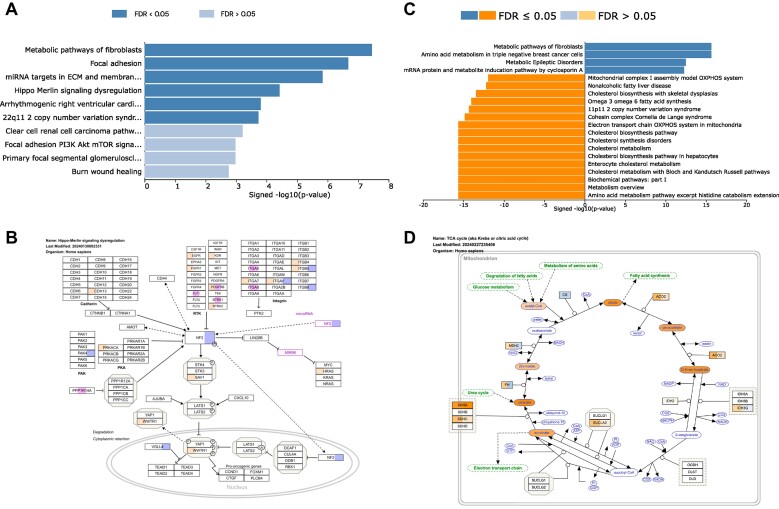
Figure 2.
Examples of multi-list analysis output. (A) An ORA-based meta-analysis of three input gene lists reports enriched pathways from the integrated analysis. (B) A multi-colored pathway map for a pathway enriched in the meta-analysis, highlighting genes from the individual input gene lists. (C) A GSEA-based multi-omics analysis reports enriched pathways from the integrated analysis of RNA, protein, and metabolite data. (D) A multi-colored pathway map visualizing input values from different data types for all leading-edge genes identified in the analysis.

