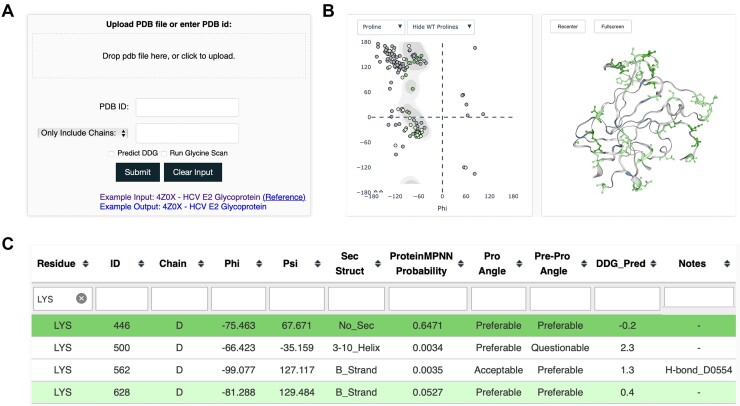
Figure 1.
Proscan submission and results pages. (A) Proscan submission page, allowing user-input PDB structure or PDB code input, along with user-specified options. (B) Results page visualization, with proline Ramachandran plot, showing input structure residue Φ/Ψ backbone angles plotted as points (left), and interactive structure viewer (right). Ramachandran plot points and residues on structure are colored based on predicted proline favorability and score criteria. (C) Results page table, showing scores and annotations for each residue and proline substitution favorability. Cells are colored based on score favorability. Example structure shown for (B) and (C) is the HCV E2 glycoprotein core (PDB code 4MWF, chain D) (36). Residues in results table rows and figures are colored by predicted proline favorability (light green = possibly favorable, green = likely favorable).

