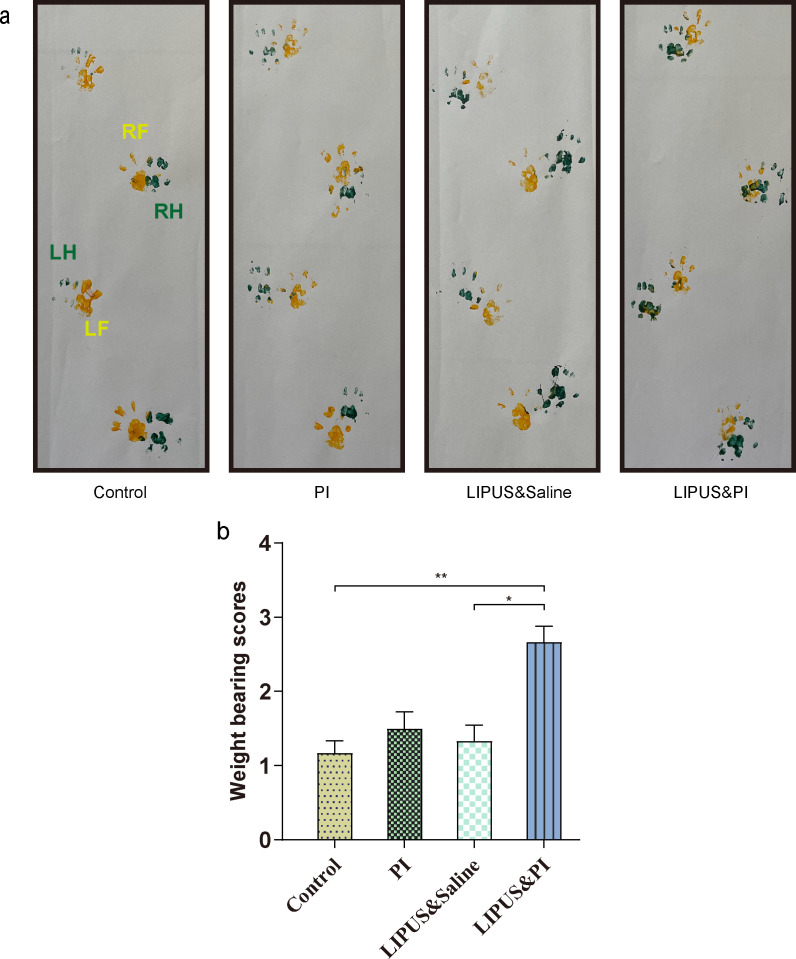
Fig. 3.
Evaluation of weightbearing analysis. a) Representative images of ink blotting trails of different groups. RH, right hind (green); LH, left hind (green); RF, right front (yellow); LF, left front (yellow). b) Grade of weightbearing score among the different groups (n = 6 per group). The four treatment groups were as follows: Control group (sham); PI group (0.35% povidone-iodine); LIPUS and saline group (low-intensity pulsed ultrasound combined with saline); and LIPUS and PI group (low-intensity pulsed ultrasound combined with 0.35% povidone-iodine). Data are presented as means and standard errors of the means. *p < 0.05, **p < 0.01; one-way analysis of variance.

