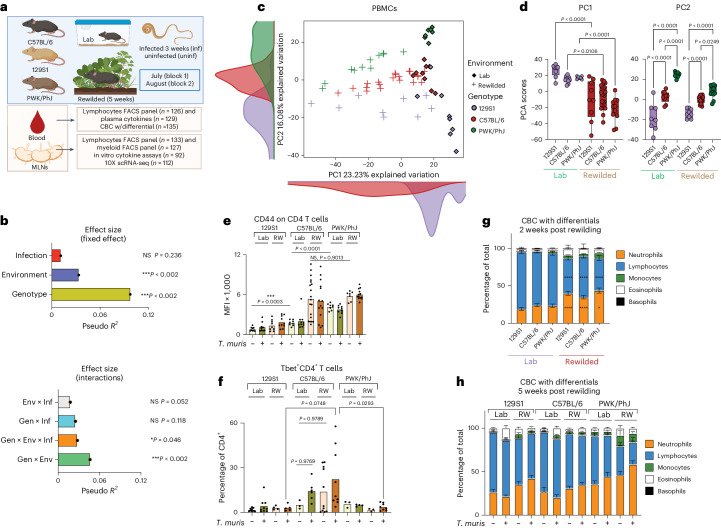
Fig. 1. Gen × Env interactions drive PBMC immune variation.
a, Experimental design. b, Bar plots showing the pseudo R2 measure of effect size of predictor variables and interactions as calculated by MDMR (n = 64; 17 129S1, 29 C57BL/6 and 18 PWK/PhJ mice). c, PCA of immune cell clusters identified by unsupervised clustering (n = 64; 17 129S1, 29 C57BL/6 and 18 PWK/PhJ mice) in the blood. d, Box plot showing variance on PC1 and PC2 axes of PCA plots in c. The box plot center line represents median, the boundaries represent IQR, with the whiskers representing the upper and lower quartiles ±1.5 × interquartile range (IQR); all individual data points are shown (129S1 Lab = 8, C57BL/6 = 9, PWK/PhJ Lab = 7, 129S1 RW = 9, C57BL/6 RW = 20, PWK RW = 11). e,f, Bar plots showing GMFI of CD44 on blood CD4+ T cells (e), and percentage of Tbet+ CD4 T cells of Live, CD4+ T cells (f) (Block 2 only, n = 64). g,h, Bar plots showing percentages of neutrophils, lymphocytes, monocytes, eosinophils and basophils out of total at 2 weeks post rewilding (n = 139, 40 129S1, 52 C57BL/6, 47 PWK/PhJ over two experimental blocks), *P < 0.05, ****P < 0.0001 (see details in the Source Data) (g), and 5 weeks post rewilding based on assessment by CBC with differentials (n = 135, 41 129S1, 51 C57BL/6, 43 PWK/PhJ over two experimental blocks) (h) (full raw dataset can be found in Supplementary Data 4). Statistical significance was determined based on MDMR analysis with R package (b) or based on one-way ANOVA one-tailed test between different groups with GraphPad software (d–f). For e and f, direct comparison was done between groups of interest with one-way ANOVA test. For g, two-way ANOVA with Tukey’s multiple comparison was done to calculate column effect. Data are displayed as mean ± s.e.m. and for d, e and f bar plots dots represent individual mice. Not significant (NS) P > 0.05; *P < 0.05; **P < 0.01; ***P < 0.001; ****P < 0.0001. MFI, mean fluorescence intensity; RW, rewilded.

