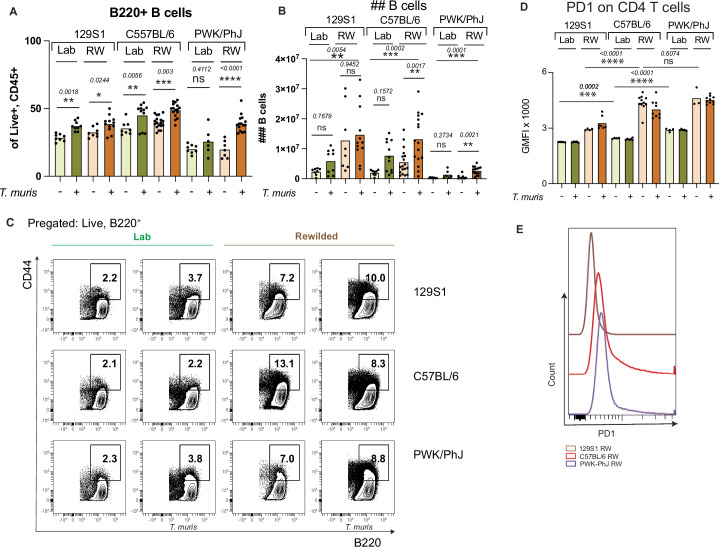
Extended Data Fig. 4. Genetics and Environmental effects on B cell and T cell phenotype.
Bar plots showing (A) frequencies and (B) numbers of B cells in the mesenteric lymph node, For (A) and (B) n = 126, 129S1 Lab Uninfected = 8, 129S1 Lab T. muris = 9, 129S1 RW Uninfected = 8, 129S1 RW T. muris = 12, C57BL/6 Lab Uninfected = 8, C57BL/6 Lab T. muris = 11, C57BL/6 RW Uninfected = 18, C57BL/6 RW T. muris = 16, PWK/PhJ Lab Uninfected = 8, PWK/PhJ Lab T. muris = 6, PWK/PhJ RW Uninfected = 7, PWK/PhJ RW T. muris = 15 over two experimental blocks; each dot represent individual mice. (C) Representative FACS plots showing percentage of CD44 high B cells in the mesenteric lymph node. (D) Bar plots depicting GMFI of PD1 on MLN CD4 + T cells,) n = 73, 129S1 Lab Uninfected = 5, 129S1 Lab T. muris = 5, 129S1 RW Uninfected = 4, 129S1 RW T. muris = 7, C57BL/6 Lab Uninfected = 4, C57BL/6 Lab T. muris = 6, C57BL/6 RW Uninfected = 11, C57BL/6 RW T. muris = 9, PWK/PhJ Lab Uninfected = 4, PWK/PhJ Lab T. muris = 5, PWK/PhJ RW Uninfected = 3, PWK/PhJ RW T. muris = 10 over one experimental block, Block = 2 (E) Representative Histogram showing concatenated files from rewilded uninfected mice of each mice strain. Statistical significance was determined by one-way ANOVA one tailed test between different groups of interest with Graph-Pad Software (A), (B) and (D). For (A) and (B) direct comparison was done within each genotype; for (D), comparison was done between genotypes in the same environment with one-way ANOVA one tailed test. Data are displayed as mean ± SEM. ns p > 0.05; * p < 0.05; ** p < 0.01; *** p < 0.001; **** p < 0.0001. RW, Rewilded.

