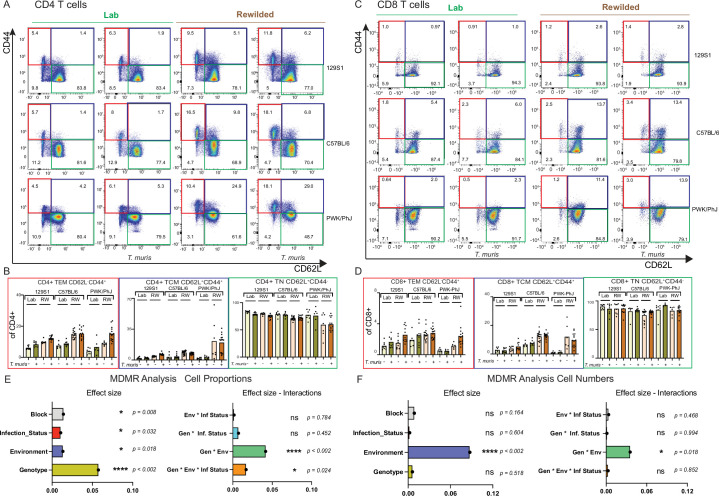
Extended Data Fig. 5. Genetics by Environment Interactions determine variation in T cell phenotype.
MLN cells from different strains of mice in the laboratory and rewilded conditions were harvested and the proportion of the Naïve and memory CD4 and CD8 T cell subset were determined by flow cytometric analysis. Representative flow cytometry plots and quantification of CD62LhiCD44lo, CD62LhiCD44hi, and CD62LloCD44hi CD4 T cells in CD4 T cells (A), (B) and the CD8 T cell (C) and (D) cellular population. For (B) and (D), n = 117; 129S1 Lab Uninfected = 8, 129S1 Lab T. muris = 9, 129S1 RW Uninfected = 8, 129S1 RW T. muris = 12, C57BL/6 Lab Uninfected = 6, C57BL/6 Lab T. muris = 9, C57BL/6 RW Uninfected = 17, C57BL/6 RW T. muris = 15, PWK/PhJ Lab Uninfected = 7, PWK/PhJ Lab T. muris = 5 PWK/PhJ RW Uninfected = 6, PWK/PhJ RW T. muris = 15 over two experimental blocks. Grubb’s outlier test was done to remove outliers. Bar plots showing the pseudo R2 measure of effect size of predictor variables and interactions as calculated by multivariate distance matrix regression analysis (MDMR) in based on (E) proportions and (F) cell numbers from the CD4 and CD8 T cell lymphoid cells CD4 T cell clusters harvested from the MLN. Raw data – Data File S6.

