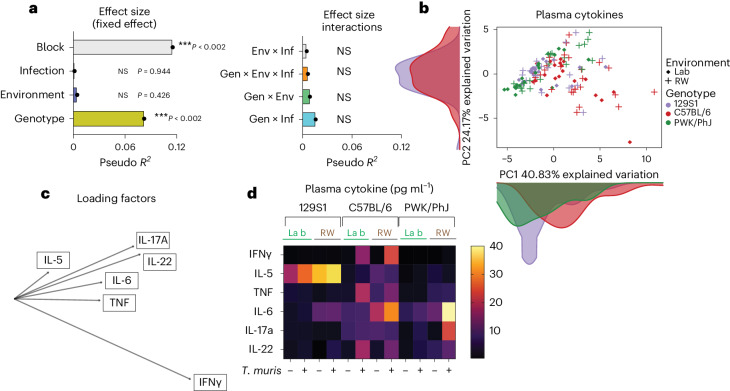
Fig. 4. Genotype has a bigger effect on plasma cytokine responses.
a, Bar plots showing the pseudo R2 measure of effect size of predictor variables (left) and interactions (right) as calculated by MDMR from plasma cytokine data, n = 129; over two experimental blocks. b,c, PCA showing circulating plasma cytokine levels (b), raw data (Supplementary Data 6) and their loading factors (c). d, Heatmap depicting circulating plasma cytokine levels in n = 129; 48 129S1, 39 C57BL/6 and 42 PWK/PhJ mice over two experimental blocks, Block 1 and Block 2. Data were transformed to ensure normality before analysis. NS P > 0.05; *P < 0.05; **P < 0.01; ***P < 0.001; ****P < 0.0001.

