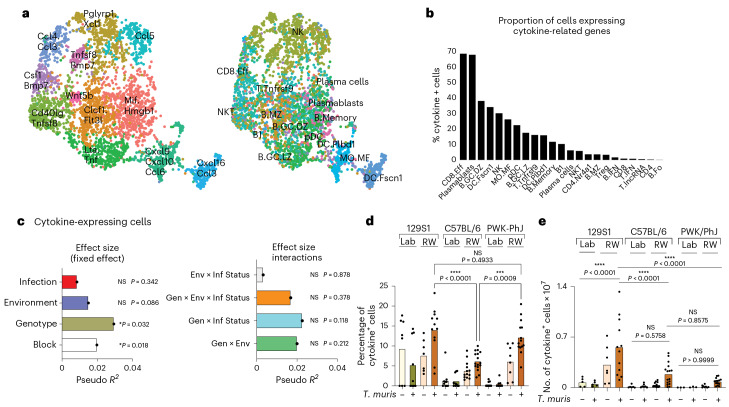
Fig. 7. Single-cell sequencing analysis for assessing immune variation in cytokine profiles.
a, Cytokine-expressing cell clusters. b, Proportion of cells expressing cytokine-related genes of those identified in a. c, Bar plots showing the pseudo R2 measure of effect size of predictor variables and interactions as calculated by MDMR analysis based on data from proportion of cytokine-expressing cells identified in a. d,e, Bar plots showing proportion (d) and numbers (e) of cytokine-expressing cells identified in a, For c, d and e, n = 99; 129S1 Lab Uninfected = 5, 129S1 Lab T. muris = 5, 129S1 RW Uninfected = 7, 129S1 RW T. muris = 12, C57BL/6 Lab Uninfected = 6, C57BL/6 Lab T. muris = 7, C57BL/6 RW Uninfected = 13, C57BL/6 RW T. muris = 16, PWK/PhJ Lab Uninfected = 3, PWK/PhJ Lab T. muris = 3, PWK/PhJ RW Uninfected = 8, PWK/PhJ RW T. muris = 14 over two experimental blocks. Statistical significance was determined on MDMR analysis with R package for c. For d and e, one-way ANOVA test with comparison by Tukey’s multiple analysis was used to test statistical significance between the different groups of interest. Data are displayed as mean ± s.e.m. and for d and e bar plots dots represent individual mice. NS P > 0.05; *P < 0.05; **P < 0.01; ***P < 0.001; ****P < 0.0001.

