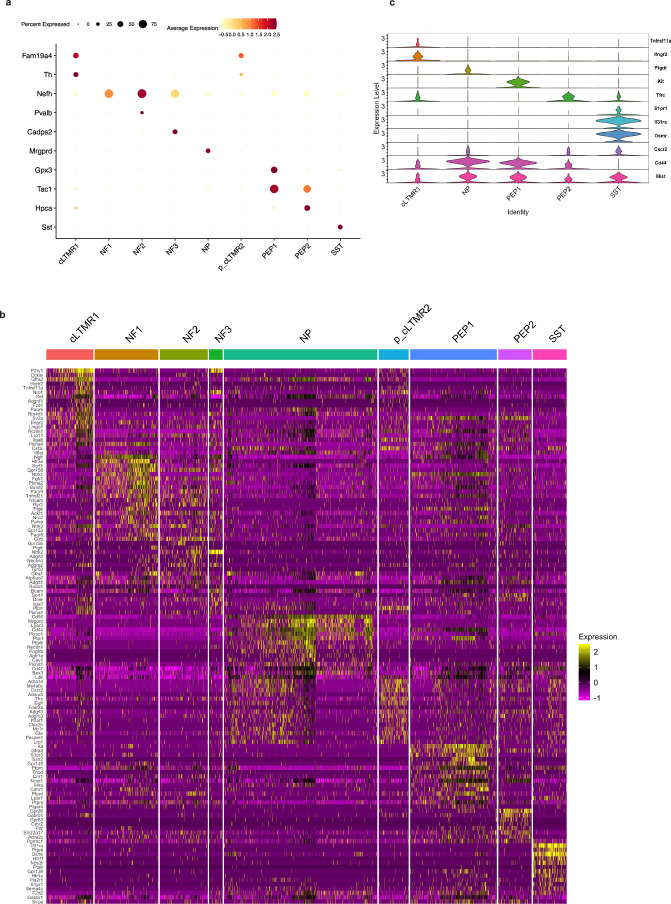
Extended Data Fig. 5. Receptor expression profile in male DRG neurons.
(a) Dot plot showing marker genes used to annotate given DRG subtypes. (b) Differential expression of receptor genes in cLTMR1, NF1, NF2, NF3, NP, p_cLTMR2, PEP1, PEP2 and SST, and cLTMR cells from male DRG neurons, from ref. 4. Heatmaps show significantly (adjusted p < 0.05) differentially expressed genes in neurons with log2FC = 0.5 and min. pct. = 0.25. (c) Violin plot showing normalized expression of specific receptor genes in cLTMR1, PEP1, PEP2, NP and SST neurons.

