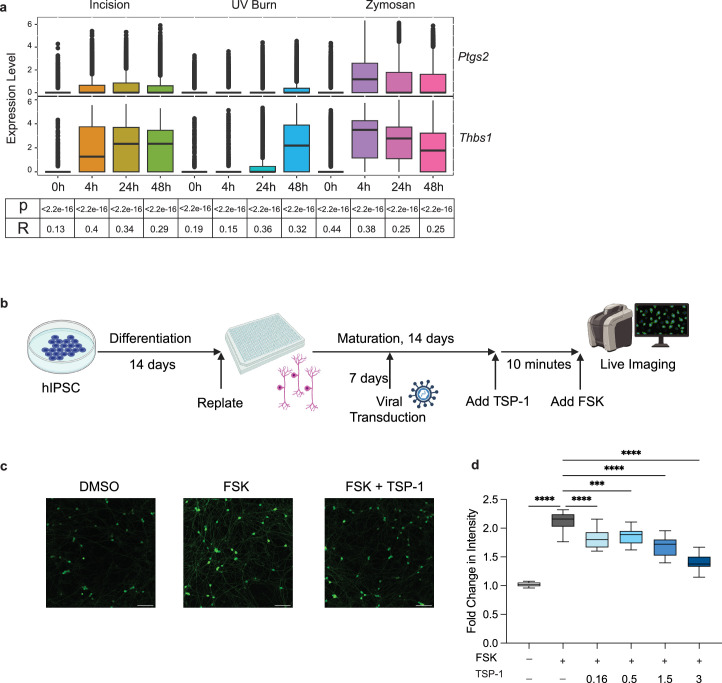
Extended Data Fig. 8. Human TSP-1 inhibits PKA activity in human sensory neurons.
(a) Box plot of Ptgs2 and Thbs1 expression showing normalized expression of the two genes. Upregulation of Thbs1 mirrors pain hypersensitivity as observed in Fig. 1a. The p-values and correlation coefficients indicated below are calculated using the Pearson correlation analysis for the average expression Thbs1 and Ptgs2 at each timepoint per condition. (b) Timeline of iPSC-derived sensory neuron differentiation, viral transduction and experimental treatments. (c) Representative images of iPSC-derived sensory neurons expressing PKA reporter (green) treated with DMSO, forskolin (FSK), or FSK + TSP1. The scale bar is 100 μm. Representative of two independent experiments with at least 9 wells in each condition. (d) Box plot graph showing the fold change (post/pre-treatment) in fluorescent intensity of PKA reporter in cells treated with FSK alone or FSK in the presence of escalating doses of TSP1. DMSO, n = 9; FSK, n = 18; TSP1 0.16 ug/ml, n = 9; TSP1 0.5 ug/ml, n = 9; TSP1 1.5 ug/ml, n = 9; TSP1 3 ug/ml, n = 9; TSP1 5 ug/ml, n = 9; TSP-1 10 ug/ml, n = 9 Bounds of box and whiskers are 25% and 75% percentile with 95% confidence level. One-way ANOVA was performed (n = 3 independent experiments), **p < 0.005, ***p < 0.001, ****p < 0.0001.

