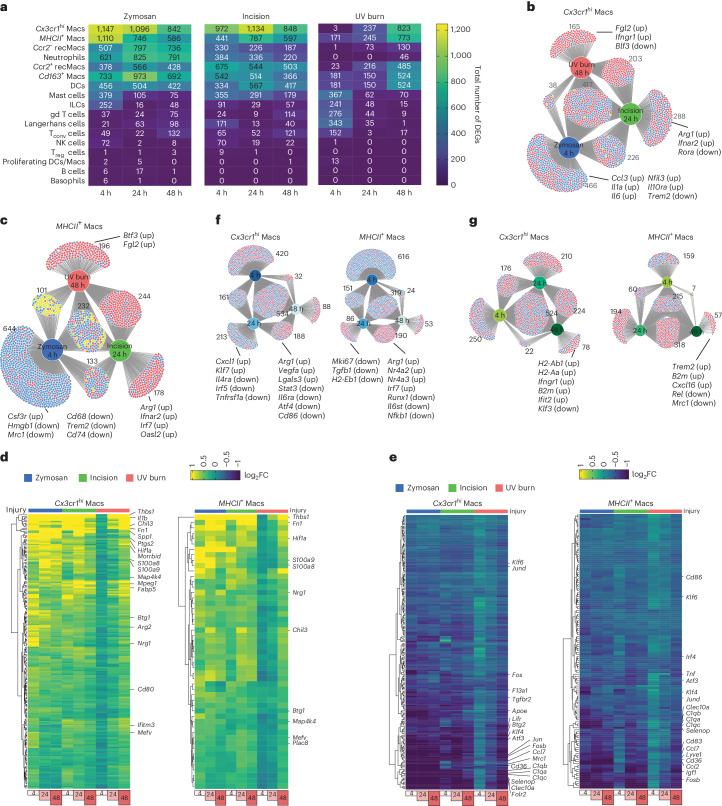
Fig. 2. Macrophage transcriptional changes mirror pain hypersensitivity.
a, Heatmaps showing the total number of differentially expressed genes (upregulated and downregulated combined) compared to CL in each immune cell type. For differentially expressed genes (DEGs), log2FC threshold of 0.25 and min.pct of 0.1 was applied. b,c, DiVenn plots showing the overlap of DEGs in different injuries at Tmax (zymosan at 4 h, incision at 24 h and UV burn at 48 h) compared to CL in Cx3cr1hi Macs (b) and MHCII+ Macs (c). d,e, Heatmaps showing the log2FC of the upregulated DEGs common in zymosan at 4 h, incision at 24 h and UV burn at 48 h compared to CL controls in Cx3cr1hi Macs (d) and MHCII+ Macs (e). f, DiVenn plots showing the overlap of DEGs in zymosan at different time points of 4 h, 24 h and 48 h compared to CL in Cx3cr1hi Macs and MHCII+ Macs. g, DiVenn plots showing the overlap of DEGs in incision at different time points of 4 h, 24 h and 48 h compared to CL in Cx3cr1hi Macs and MHCII+ Macs. In b, g and h, the red circle denotes upregulated, the blue circles denote downregulated and the yellow circle denotes divergent regulated genes.

