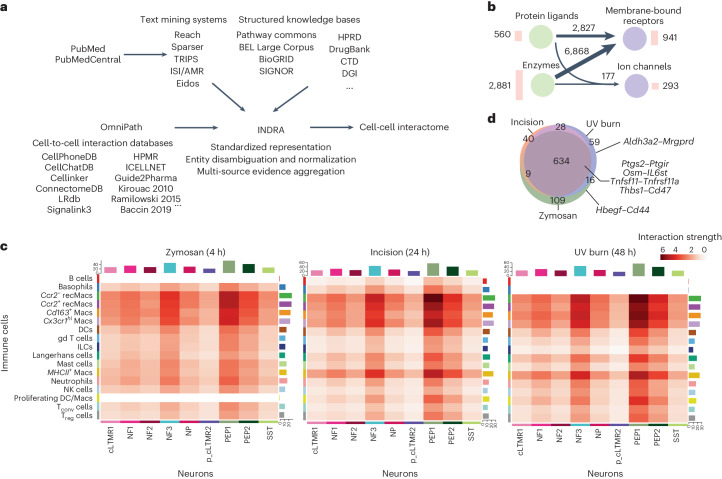
Fig. 4. Macrophages are the strongest interactors of sensory neurons.
a, An overview of the computational pipeline in which INDRA processes publications through multiple text mining systems and combines their output with structured knowledge bases integrated with INDRA directly, as well as the content of cell-to-cell interaction databases obtained via OmniPath to create an assembled cell–cell interactome. b, Summary of the modalities of the interactome derived from INDRA. Circles represent types of proteins: ligands, enzymes, membrane-bound receptors and ion channels. Numbers next to the circle represent protein types in the interactome. Arrows between circles show the number of distinct interactions among the corresponding protein type, with thicker arrows corresponding to a larger number of interactions. c, A heatmap of the interaction strength between immune cells (senders) and neurons (receivers) calculated for zymosan, incision and UV burn at Tmax. Color saturation represents the communication probability between the senders and receivers calculated by CellChat. d, Venn diagram depicting the number of shared and unique significant neuroimmune interactions for zymosan, incision and UV burn at Tmax.

