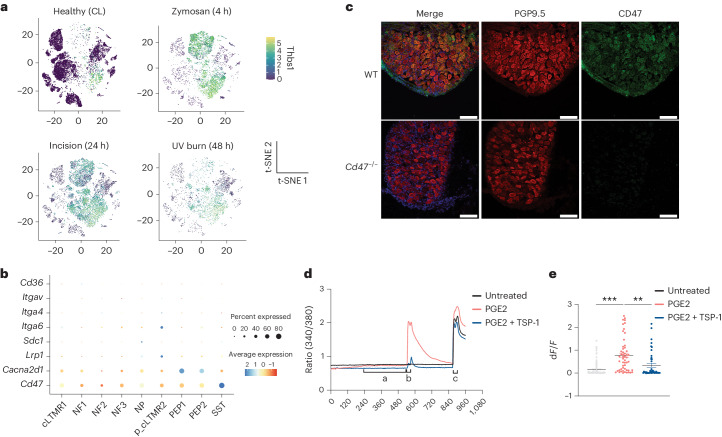
Fig. 5. TSP-1 inhibits PGE2-mediated nociceptor sensitization.
a, t-SNE plot of normalized Thbs1 expression in immune cells from healthy (CL) and inflamed skin following zymosan, incision and UV burn injury at Tmax. b, Dot plot showing the expression of TSP-1 receptors (Cd47, Cacna2d1, Lrp1, Sdc1, Itga6, Itga4, Itgav and Cd36) in DRG neuron subtypes (cLTMR1, NF1, NF2, NF3, NP, p_cLTMR2, PEP1 and PEP2) in wild-type (WT) healthy mouse lumbar DRG4. c, The expression of CD47 on frozen wild-type or Cd47−/− DRG neuron sections stained with PGP9.5. Scale bar, 100 μm. Representative of two independent experiments. d, Fura-2-based calcium imaging in cultured sensory neurons from DRG obtained from WT male mice treated with SES, 1 µM PGE2 or 1 µM PGE2 + 200 ng ml−1 TSP-1 for 7 min, followed immediately by 100 nM capsaicin, 100 nM capsaicin + 1 µM PGE2 or 100 nM capsaicin + 1 µM PGE2 + 200 ng ml−1 TSP-1, respectively for 30 s, a 5 min SES wash and treatment with 1 µM capsaicin for 30 s. SES was used as the recording solution. Treatments were applied during live imaging using a gravity-based perfusion system. Frames were captured every 3 s. Intensity traces of ratio of 340/380 are plotted. e, dF/F calculated as (F1 − F0)/F0, where F1 is the peak response within 40 s of treatment with 100 nM capsaicin and F0 is the average of 10 s before the PGE2-treatment time point. SES, n = 80; PGE2, n = 55; PGE2 + TSP, n = 42. All TRPV1+ neurons are from one experiment consisting of three separate recordings for each condition. Data are represented as mean value ± s.e.m. Unpaired two-tailed t-test was performed. P < 0.05 was considered significant. An individual dot represents a neuron that was included in the analysis. Data are representative of three independent experiments.

