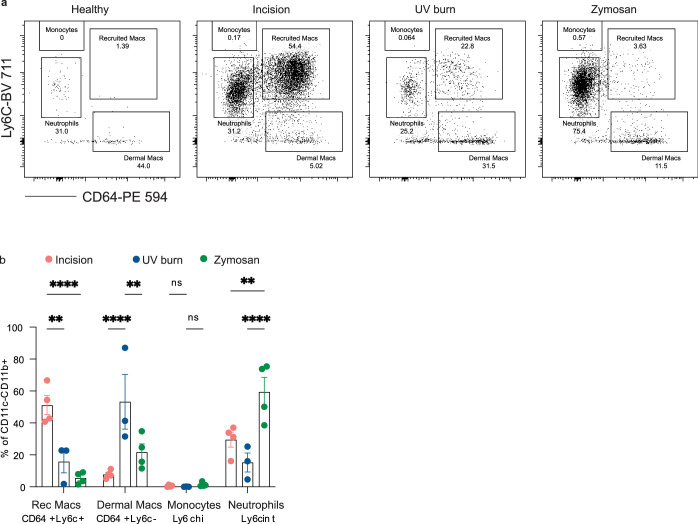
Extended Data Fig. 2. Different injuries show distinct myeloid cell populations at Tmax.
Immune cells were isolated from injured or healthy paw skin and stained for various myeloid cell markers. (a) Immune cells isolated from injured paw skin stained for myeloid cell markers. Representative flow plots are gated on Live CD45 + CD11b + CD11c-cells. (b) Quantification of myeloid cell populations in incision (24 h) (n = 4), UV burn (48 h) (n = 3), and zymosan (4 h) (n = 4). Data is gated on live CD45 + CD11b + CD11c- cells. Data are represented as mean value ± SEM. p values calculated using one-way ANOVA, Tukey’s multiple comparison test. * p < 0.05, ** p, 0.01, *** p < 0.001,*** p < 0.0001, ****<0.00001 and n.s. = not significant.

