Figure 4.

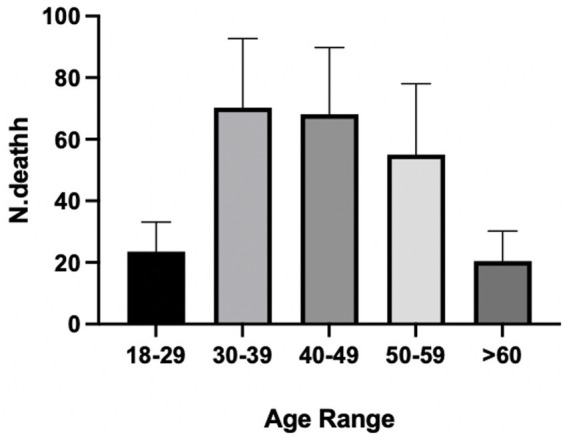
Data on the prevalence of work-related fatalities by age. Age groups are representative of a sample of 1,662 subjects whose gender was numerically specified in the selected studies.

Data on the prevalence of work-related fatalities by age. Age groups are representative of a sample of 1,662 subjects whose gender was numerically specified in the selected studies.