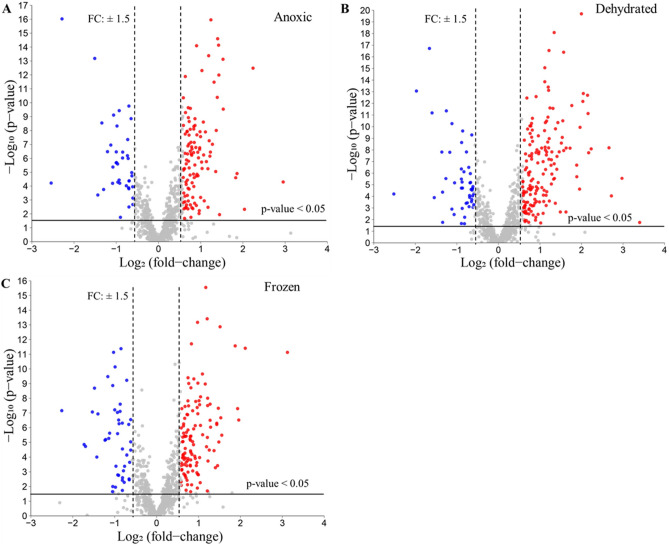
Figure 4.
Volcano plots of quantified proteins from liver. Protein quantities between the three conditions and the control group were compared. Red dots indicate proteins that were upregulated under the stress condition; blue dots indicate proteins that were downregulated under the stress condition; grey dots show proteins that did not change significantly between control and stress conditions. The analysis threshold was p-value < 0.05 and the fold change (FC) > 1.5 or < 0.67; anything below these thresholds was considered not significant. (A) Volcano plot of anoxic vs. control; (B) Volcano plot of dehydrated vs. control; (C) Volcano plot of frozen vs. control.

