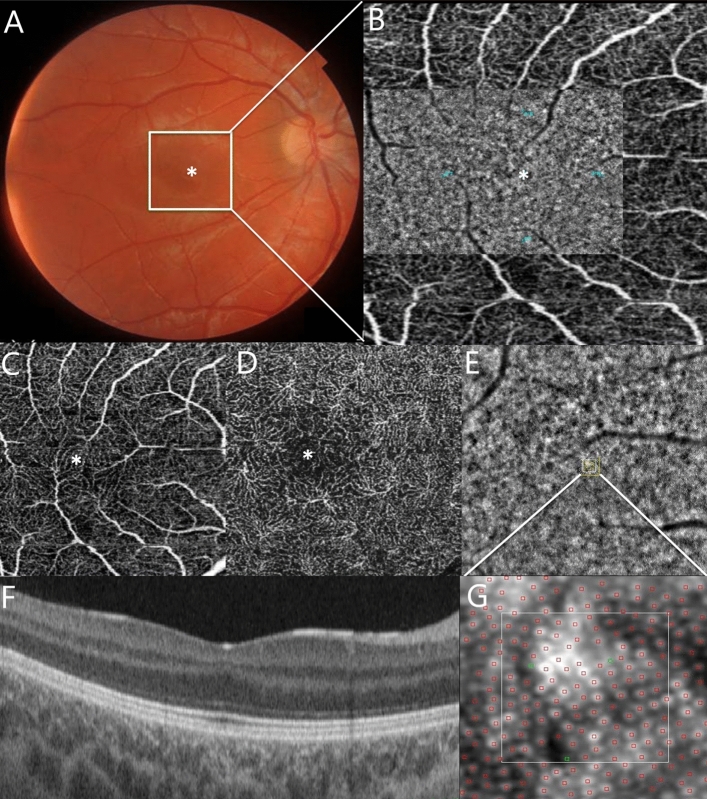
Figure 1.
Composite imaging showing a sample of acquisition and interpretation of data. (A) Color fundus photography of the RE of a 15-year-old female affected by grade 1 foveal hypoplasia (P8F). The image in the white square is magnified in B. (B) 3 × 3 mm OCTA of the SCP of the patient’s RE. (B) Flood-illuminated Adaptive Optics (FIAO) image montage overlaid on the OCTA image of the SCP demonstrates the appearance of the cone mosaic. The cone counting was measured at 2° eccentricity from the fovea in four meridians: nasal, temporal, superior and inferior (blue dots). (C) SCP and (D) DCP showing the lack of the fovea avascular zone (FAZ) on OCT angiography. (E) FIAO imaging of the cone mosaic nasally to the fovea showing the appearance of the cone mosaic. The yellow square is magnified in G and represents the Region Of Interest (ROI) where the cone mosaic was counted. This area is located at 2° eccentricity from the fovea in the nasal area. (F) Structural OCT showing persistence of the inner retinal layer and the presence of a widening of the outer nuclear layer15. (G) Magnification image of the yellow square in picture E shows the cone counting analyzed using the software package AO Detect Mosaic V.3.0. The manufacturer’s software automatically detects the cone mosaic and the position of the photoreceptors; it also enables manual correction.

