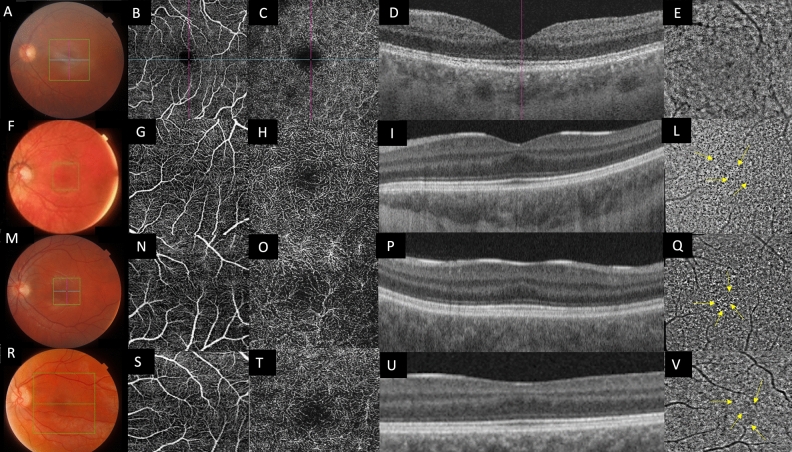
Figure 2.
Composite imaging of multimodal imaging of FH: (A–E): normal control. (F, M, R) Color fundus photography of the LE of patients affected by foveal hypoplasia: corresponding OCT-A examinations of the SCP (G, N, S) and DCP (H, O, T). Cross sectional SS-OCT passing through the fovea (I, P, U). (L, Q, V) AO Imaging showing the appearance of the cone mosaic at the macula. The cone photoreceptors appear as ‘bright’ hyper-reflective dots over either a hyporeflective or isoreflective background: to ease the view, the image of the little red square was zoomed in the big red square on the bottom right corner of each AO report. Yellow arrows indicate the “pigmentary abnormalities” (see text).

