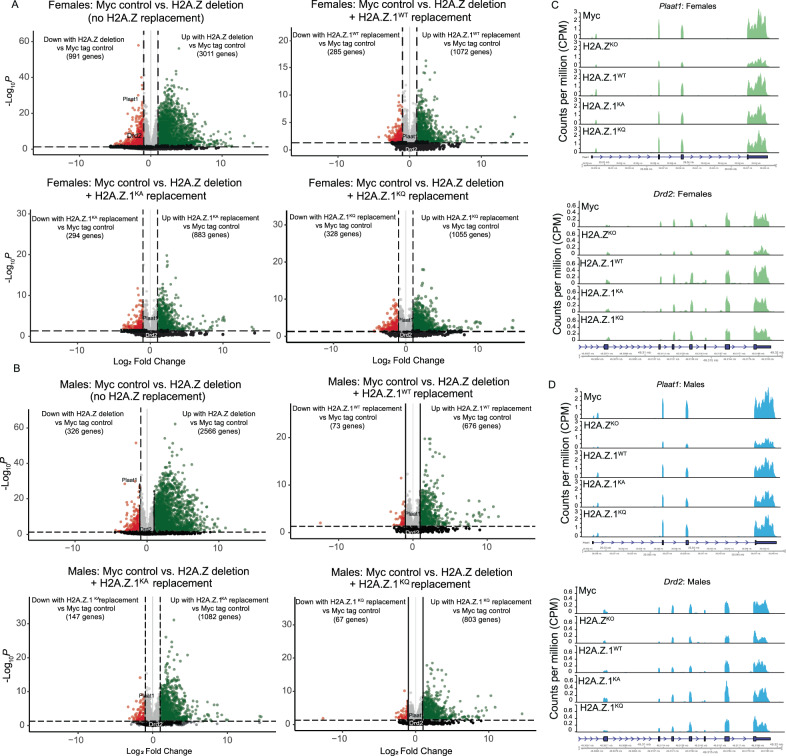
Fig. 3. H2A.Z deletion and expression of lysine mutants impact gene expression.
Volcano plots showing effects of H2A.Z deletion alone (H2A.ZKO) and H2A.Z deletion combined with H2A.Z.1WT, H2A.Z.1KA, or H2A.Z.1KQ replacement on transcript levels in (A) female and (B) male mice. Red and green circles indicate differentially expressed genes (DEGs) with FDR < 0.05 and log2FC > 1 that are significantly increased or decreased relative to the Myc control group. Gray circles represent significant DEGs with FDR < 0.05 and log2FC < 1. Black circles indicate genes that did not meet significance criteria. Number of DEGs shown in brackets reflect FDR < 0.05 and log2FC > 1. Example gene tracks are shown for (C) female and (D) male mice. Data in gene tracks are expressed as Counts Per Million (CPM). N/group is as follows. Males: Myc 4, H2A.ZKO 4, H2A.Z.1WT5, H2A.Z.1KA 4, H2A.Z.1KQ 5. Females: Myc 3, H2A.Z.1KO4, H2A.Z.1WT 4, H2A.Z.1KA 4, H2A.Z.1KQ 3.

