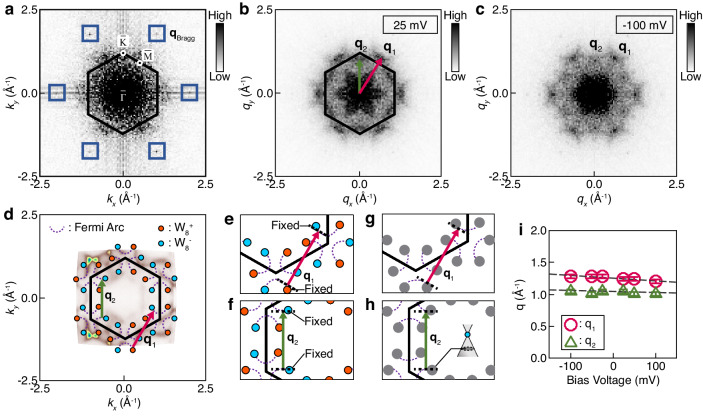
Fig. 6. STM analysis on Fermi-arc states of [Gd2C]2+·2e−.
a Fourier transformed the image of the topographic image (Fig. 5d). The blue boxes indicate the Bragg peaks. b, c Fourier transformed images of the dI/dV maps (Fig. 5e, f). Two distinct QPI modulation vectors are identified as q1 (red arrow) and q2 (green arrow). d Schematics illustrating Fermi-arc states, overlaid with ARPES data for clarity. The q1 and q2 vectors joining the Fermi-arc states are assigned by considering their sizes and directions. e, f Nesting conditions for the q1 and q2 vectors. g, h Nesting conditions for q1 and q2 at a lowered bias voltage. The dispersion of Fermi-arc states is minimal near the Weyl cone, leading the q1 and q2 vectors to remain unaltered significantly. i Dispersion of q1 (red circles) and q2 (green triangles) by the bias voltage. The dashed lines are given for eye-guides. The error bar represents the momentum uncertainty resulting from the resolution of dI/dV maps.

