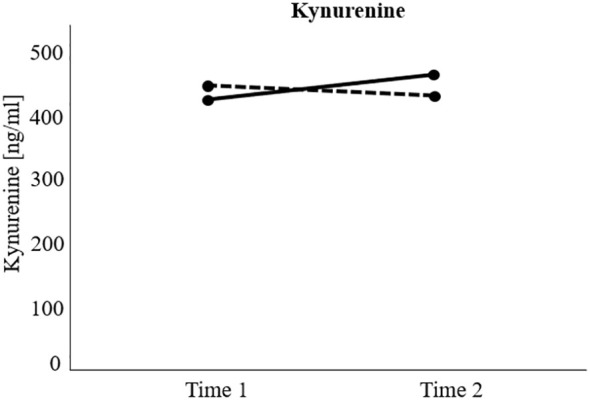
Figure 2.

Visualization of significant interaction effect of the repeated measure analyses of (co)variance investigating treatment response (responders versus non-responders) and time differences (measurement time 1 versus measurement time 2) regarding kynurenine levels over time. Non-responders = Black solid line. Responders = Black dotted line. Kynurenine increased significantly over time in the non-responder group, but not in the responder group.
