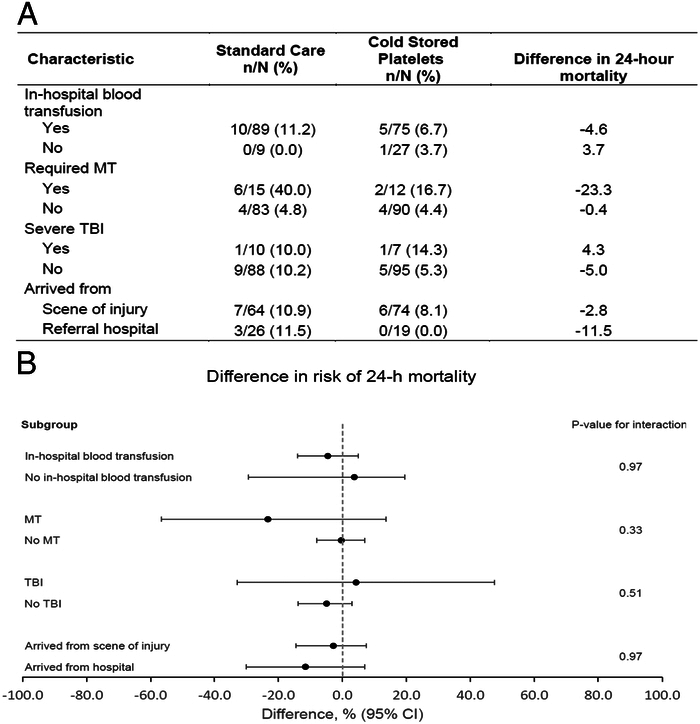
FIGURE 3.

Subgroup analysis for 24-hour mortality. A, Differences in 24-hour mortality in the 4 prespecified subgroups. B, Twenty-four hour mortality differences with CIs. The black circles represent the difference in 24-hour mortality and horizontal bars represent the 95% CI. The difference was computed as 24-hour mortality for CSP minus 24-hour mortality for SC. The 95% CIs are exact (Clopper-Pearson) confidence limits. The gray dashed vertical line represents a difference in 24-hour mortality of 0, indicating no difference in 24-hour mortality between CSP and SC treatment arms. P-values are for the interaction term between treatment arms and subgroup in a logistic regression model with 24-hour mortality as the outcome. CSP indicates cold stored platelets; SC, standard care; MT, massive transfusion; TBI, traumatic brain injury.
