

Abstract
Variants in cis-regulatory elements link the noncoding genome to human pathology; however, detailed analytic tools for understanding the association between cell-level brain pathology and noncoding variants are lacking. CWAS-Plus, adapted from a Python package for category-wide association testing (CWAS), enhances noncoding variant analysis by integrating both whole-genome sequencing (WGS) and user-provided functional data. With simplified parameter settings and an efficient multiple testing correction method, CWAS-Plus conducts the CWAS workflow 50 times faster than CWAS, making it more accessible and user-friendly for researchers. Here, we used a single-nuclei assay for transposase-accessible chromatin with sequencing to facilitate CWAS-guided noncoding variant analysis at cell-type-specific enhancers and promoters. Examining autism spectrum disorder WGS data (n = 7280), CWAS-Plus identified noncoding de novo variant associations in transcription factor binding sites within conserved loci. Independently, in Alzheimer’s disease WGS data (n = 1087), CWAS-Plus detected rare noncoding variant associations in microglia-specific regulatory elements. These findings highlight CWAS-Plus’s utility in genomic disorders and scalability for processing large-scale WGS data and in multiple-testing corrections. CWAS-Plus and its user manual are available at https://github.com/joonan-lab/cwas/ and https://cwas-plus.readthedocs.io/en/latest/, respectively.
Keywords: genetic association, whole-genome sequencing, regulatory noncoding variant, rare variant, noncoding genome
Graphical Abstract
Graphical Abstract.
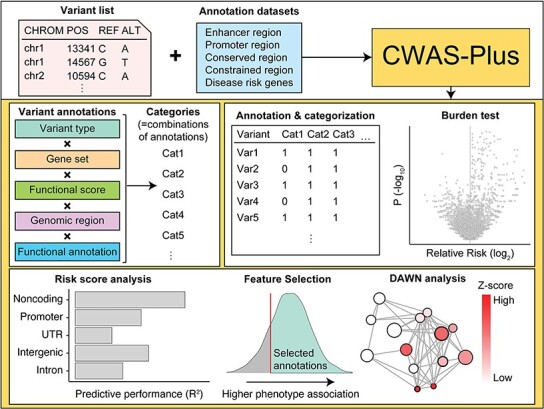
Flowchart illustrating the CWAS-Plus workflow. The process starts with a variant list (showing chromosome positions and reference/alternate alleles) combined with annotation datasets (enhancer, promoter, conserved, constrained regions, and disease risk genes). CWAS-Plus processes this information, creating categories by combining variant annotations (variant type, gene set, functional score, genomic region, and functional annotation). These categories undergo annotation and categorization, followed by a burden test (volcano plot displaying p-values and relative risk). The analysis includes risk score analysis (bar graph of model performance for different genomic regions), feature selection (density plot showing higher phenotype association), and DAWN analysis (network graph highlighting disease-associated clusters with varying z-scores).
Introduction
The noncoding regions of the genome contain key regulatory elements, including promoters and enhancers, which are essential for tissue-specific gene expression and play a vital role in cellular and organ development during early human development [1, 2]. Recent large-scale single-cell assays for transposase-accessible chromatin with sequencing (ATAC-Seq) studies have identified cell type-specific noncoding elements at critical developmental milestones and profiled key regulatory enhancers of gene expression dynamics [3, 4]. Disruption of these elements by genetic variants may alter gene expression in biological pathways and consequently lead to human disorders [5–7]. Notably, most of the associations from genome-wide association studies (GWAS) are in noncoding regions enriched for regulatory elements [8, 9], highlighting the importance of identifying variants within these key regulatory elements in the noncoding sequences to gain critical insights into genetic disorders.
Recent advances in whole-genome sequencing (WGS) have enabled the identification and risk evaluation of rare noncoding variants for disorders [10, 11]. Several methods prioritize high-risk noncoding variants (RNVs) using scoring systems based on functional annotations but lack statistical evaluation for genome-wide associations [12–19]. With the growing volume of WGS data, new methods have emerged for genome-wide genetic association studies of noncoding variants, focusing on functional regions [20] or predefined genomic windows [21]. Phenotype–genotype association studies with functional regions have also been introduced [22]. Recently, we developed the category-wide association study (CWAS), a novel statistical framework to identify noncoding associations from WGS data [23]. This method utilizes variant groups, called categories, for genetic association testing and creates multiple categories based on genomic and functional annotations related to noncoding variants. Traditional GWAS assess associations at the locus level, which can result in insufficient statistical significance for rare variants. CWAS addresses this limitation by conducting association tests on categorized variants, making it applicable for rare variants. With CWAS, we have successfully identified that noncoding variants in conserved regions of promoters are significantly enriched for autism spectrum disorder (ASD) [24].
Herein, we introduce CWAS-Plus, a Python package that enhances CWAS for identifying genetic associations among noncoding variants. CWAS-Plus significantly reduces run time and computational requirements, resulting in faster and more efficient execution of the entire CWAS workflow. CWAS-Plus integrates multiple datasets to define functional regions or genes of interest provided by the users as bed files or gene sets. Additionally, it introduces a novel approach for multiple-testing corrections, further enhancing the reliability of the results. We applied CWAS-Plus to large-scale WGS datasets and, through the integration of single-cell datasets, found that ASD noncoding association disrupts transcriptional regulation. Furthermore, applying CWAS-Plus to rare variants identified microglia-specific noncoding associations with Alzheimer’s disease (AD). Taken together, we highlight the potential of CWAS-Plus for discovering noncoding risks from WGS data across various disorders.
Methods
Input requirement
CWAS-Plus requires a list of variants and samples for association testing. For the variant list, Variant Call Format (VCF) is used to include genomic position, reference allele, alternate allele, and sample identification (ID). A sample list should contain sample IDs and phenotypic labels (e.g. case or control). These inputs are subject to variant annotation for genomic regions using the Variant Effect Predictor (VEP) [25].
Users can provide adjustment factors to correct for confounding factors in the analysis. CWAS-Plus uses these adjustment factors by multiplying them by the number of variants for each sample. In our analyses, since the number of de novo variants increases with paternal age [26, 27], we adjusted for paternal ages and sample cohorts to remove biases (see ‘Adjustment factors for de novo variants’ section in Supplementary Materials for detailed methods).
Annotation
The variant annotation process involves two steps: the VEP annotation and the customized annotation. VEP annotates the most severe consequence using Sequence Ontology (SO) terms, which are then employed for categorizing genomic regions. In this study, VEP version 110 was used. Customized annotation was conducted for user-provided datasets, including functional annotation and functional score. Functional annotation refers to specific genomic regions associated with particular functions, such as epigenetic status. Functional scores indicate regions with score metrics related to genomic features, such as conservation.
Categorization
To assess the noncoding association, CWAS-Plus creates categories for variants using genomic and functional annotations. A single category is built by combining five features: (i) variant type, (ii) genomic region, (iii) gene set, (iv) functional annotation, and (v) functional score (see ‘Annotation datasets used in CWAS analysis’ section in Supplementary Materials for datasets used in each feature). Among the five features, gene set, functional annotation, and functional score features are user-provided datasets.
(1) Variant type: variants are classified into either single nucleotide variant (SNV) or insertion–deletion (indel) based on the length of the alleles.
(2) Genomic region: genomic region based on the location of the variant relative to genes. Genomic region is defined by utilizing SO terms from the most severe consequence and the annotated gene from VEP annotation. Genomic regions include coding domains [e.g. protein-truncating variants (PTVs), frameshift indels, missense, damaging missense, in frame indels, and silent variants] and noncoding domains (e.g. those composed of 5′ UTR, 3′ UTR, promoter, splice site, intron, intergenic, long noncoding RNA, and others), with the order corresponding to the order of variant annotation. PTVs (nonsense and frameshift) must have a high confidence level (‘HC’) using the LOFTEE plugin and be annotated with either ‘SINGLE_EXON’ or no LOFTEE flags. Damaging missense variants are required to have an MPC score of ≥2. Promoter variants are annotated as 2000 base pairs upstream of transcription start sites.
(3) Gene set: disease-relevant gene sets. Datasets should be in text format.
(4) Functional annotation: functional regions associated with epigenetic modifications or regulatory elements. Datasets should be in bed format.
(5) Functional score: score metrics related to specific genomic features, such as conservation or pathogenicity. Datasets should be in bed format.
Categories are constructed by grouping variants according to their respective annotations. Specifically, variants sharing annotations across five distinct features are consolidated into a single category. For instance, a category can be established containing intergenic SNVs near CHD8 target genes, located within excitatory neuron-specific cis-regulatory elements (CREs), and conserved genomic loci. Genetic variants exhibiting overlapping annotations across all these features are then assigned to this category.
Burden test
CWAS-Plus assesses the association within a single category by conducting burden tests through two approaches: variant-level and sample-level tests.
In the variant-level test, the case–control association is estimated by comparing the number of variants in each category. The relative risk (RR) is calculated using the following equation:
 |
 |
 |
The binomial P-value is calculated by comparing two proportions: variants in cases from total variants within a category and cases from total samples.
 |
 |
 |
 |
 |
In the sample-level test, the case–control association is estimated by comparing the number of samples carrying variants in each category. The RR is calculated using the following equation:
 |
 |
 |
The binomial P-value is calculated by comparing two proportions: cases from total samples within a category and cases from total samples
 |
 |
 |
 |
 |
Case–control label-swapping permutations generate P-values in both tests.
During burden tests, CWAS-Plus can correct confounding factors by adjusting the number of variants per sample. In this study, de novo variant counts were corrected for paternal age at birth and sample cohorts.
Risk score analysis
Risk score analysis generates risk scores for each category to identify effective phenotype predictors. CWAS-Plus employed a Lasso regression model, focusing on rare categories (<2 variants in controls), and incorporated the number of variants in each category across samples as a metric. This metric served as training data for Lasso regression, with categories as features and disease phenotypes as labels. Through Lasso regression, CWAS-Plus identifies the categories that best predict case status and assigns coefficients, defined as risk scores, to each category.
In the analyses, 80% of samples (n = 5824 for variant-level analysis; n = 869 for sample-level analysis) constituted the training set. The optimal model was determined by testing 100 lambda values from five-fold cross-validation, repeated 10 times. The lambda yielding the minimum mean cross-validated error was selected to ensure generalizability and prevent overfitting. Model performance was evaluated using the R-squared (R2) values, and significance was assessed by label-swapping 1000 times, randomly assigning phenotypes to samples.
The Lasso regression model formula can be defined as follows:
 |
where  is the observed phenotype, indicating case or control.
  is the number of variants (or samples) in each category for each sample.
  are the regression coefficients, and
  is the regularization parameter.
For feature selection, risk score analysis was applied to noncoding categories from each annotation dataset (i.e. gene set, functional annotation, and functional score). Datasets with positive R2 values were further analyzed (see ‘Risk score analysis’ section in Supplementary Materials for detailed methods).
Burden shift analysis
CWAS-Plus identifies overrepresented annotations from category-level burdens. In each permutation (n = 10 000), phenotypes are randomly assigned to samples while maintaining the original ratio. Subsequently, CWAS-Plus compares the number of significant categories of interest with those from each permutation, obtaining P-values for each phenotype.
Clustering of categories
CWAS-Plus clusters categories by calculating correlation values between two categories. The correlation is calculated based on the principle that, under the null hypothesis, the covariance is equivalent to the variance of shared variants [28]. Because a binomial random variable can be expressed as the sum of independent Bernoulli variables, the variance can be computed using the equation:
 |
where n represents the number of tests and p denotes the binomial probability, which is determined by the proportion of case samples among all samples.
Each variant is treated as an independent test, replacing the total number of tests (n) with the number of variants. Consequently, the covariance between two categories is determined by the number of shared variants. We obtained a correlation matrix of size  by calculating the standardized covariance for all pairs of categories among the total.
Finding the number of effective tests for burden test
To estimate the threshold for genome-wide significance, we converted the correlation matrix into a negative Laplacian metric. Initially, we transformed the correlation matrix into absolute values. Subsequently, we established a degree matrix by aggregating all correlation values for each category. Then, we divided the absolute correlation values by the squared values of the corresponding entries in the degree matrix, deriving the Laplacian matrix. Utilizing this matrix, eigen decomposition identified the number of eigenvalues explaining at least 99% of the variance, which determined the effective number of tests.
Detecting Association With Networks (DAWN) analysis
To investigate subnetworks within noncoding risk categories, we utilized the DAWN algorithm [29]. Metrics from risk-associated categories were converted into two-dimensional coordinates using t-distributed stochastic neighbor embedding (t-SNE), selecting the top 50 eigenvalues (excluding the first). These coordinates were clustered with k-means or Leiden methods, and disease associations were determined using a hidden Markov random field model. Permutation P-values were transformed into z-scores, and Sparse Principal Component Analysis identified key variants within each cluster. Clusters were considered significant (false discovery rate (FDR) < 5.0 10−2) if their z-scores indicated a non-random association with ASD. Variants from these significant clusters were classified as RNVs (see ‘Detecting Association With Networks (DAWN) analysis’ section in Supplementary Materials for detailed methods).
WGS datasets used in CWAS-Plus
For benchmarking CWAS-Plus, we used 255 106 de novo variants identified in 1902 ASD families from our previous WGS study [24].
For variant-level CWAS analyses, we obtained project VCF with joint genotyping in 4270 ASD families from the Simons Simplex Collection (SSC) [30] and Simons Foundation Powering Autism Research for Knowledge (SPARK) [31]. ASD families include 4354 ASD cases and 2926 unaffected control siblings. Data access and analyses were approved by the Institutional Review Board of Korea University (approval number: KUIRB-2022-0409-03). After quality control, 474 788 de novo variants identified from 7280 samples were utilized (see ‘High quality variants for variant-level analyses’ section in Supplementary Materials for detailed methods).
For sample-level CWAS analyses, we obtained 63 667 178 variants from 1196 individuals in the Religious Orders Study and the Memory and Aging Project (ROSMAP) study [32, 33]. After quality control, 25 052 701 variants from 1087 samples were utilized (see ‘High quality variants for sample-level analyses’ section in Supplementary Materials for detailed methods).
Downstream analysis
Transcription factor enrichment
We investigated the enrichment of human transcription factors (n = 1622) [34] in genes affected by RNVs, PTVs, and noncoding variants (excluding RNVs). The fisher’s exact test, followed by FDR correction, determined significance with an adjusted P-value threshold of <5.0  10−2. Background gene sets included all genes from GENCODEv44 and genes annotated to variants.
Correlation between DAWN clusters and single annotation datasets
To assess the correlation between DAWN clusters and single annotation datasets, we extracted variants from each cluster and annotation dataset. The correlation was calculated using the same method as in CWAS-Plus, where we determined the number of shared variants between two sets (either from clusters or single annotations), considering the number of variants in each set.
Comparison of CWAS-Plus with Sei, Enformer, and STAARpipeline
We compared CWAS-Plus, Sei [35], Enformer [36], and STAARpipeline [22] by analyzing 474 788 de novo variants from CWAS analyses. For Sei and Enformer, pretrained models were used. STAARpipeline was applied using the functional datasets from the variant-level CWAS analyses and the Functional Annotation of Variant–Online Resource (FAVOR) database [37], which STAARpipeline requires.
We evaluated the ability to prioritize ASD-specific risk variants by defining risk variant carriers and assessing their case-enrichment. In CWAS-Plus, risk variant carriers were samples with at least three RNVs identified in CWAS analyses. Among 40 sequence classes predicted by Sei, we focused on brain- and transcription-associated features, including TN, TF, P, CTCF groups, and brain-related E groups. For Enformer, we selected brain- and embryo-related features from the 5313 genomic tracks. For both Sei and Enformer, risk variant carriers were defined as samples with variants that exceeded absolute scores of 1.1 and 200, respectively, for each predicted feature. In STAARpipeline, carriers were defined as samples with variants from gene-centric noncoding analysis in protein-coding and noncoding RNA genes, respectively, with P < 5.0  10−2. Using these defined risk variant carriers from each tool, we calculated the odds ratio (OR) for cases and controls.
Results
Overview of the CWAS-Plus pipeline
The CWAS-Plus package includes several steps to explore the noncoding associations of genetic disorders (Fig. 1A). CWAS-Plus utilizes various datasets to annotate variants and extract relevant genomic information (Fig. 1B). The annotated information is employed for variant categorization, in which categories are defined by the combination of five features: variant type, genomic region, gene set, functional annotation, and functional score (Fig. 1B). Subsequently, association tests are conducted for each category (Fig. 1C). CWAS-Plus utilizes these associations from single categories to provide more comprehensive measurements with multiple categories, enhancing noncoding associations to identify variants contributing to disease risk more effectively.
Figure 1.

Overview of CWAS-Plus. (A) Overview of the CWAS-Plus workflow. (B) An example of annotation and categorization. (C) Burden test for a variant- and sample-level test: the number in the boxes indicates the number of variants in each category across samples. The volcano plot contains the burden test result for single categories. The x-axis indicates the RR in the log2 scale, whereas the y-axis indicates two-sided binomial P-values in the log10 scale. The dashed line indicates the study-wide significance threshold for the number of effective tests. (D) Risk score analysis: through feature selection, annotation datasets with high phenotype association are selected for further analyses. Label-swapping randomly assigns phenotypes to samples. The density plot displays the R2 distribution of label-swapped samples (n = 1000). The line represents observed R2 from the original samples. (E) Burden shift analysis: label-swapping assigns phenotypes randomly to samples. Circles represent samples. The density plot shows the distribution of significant category counts for label-swapped samples, with observed significant category counts depicted as lines. (F) Find the number of effective tests: Categories are clustered based on pairwise correlations to determine the number of effective tests. Each dot represents a category, with circles indicating clusters. The arrow highlights a network subset. (G) DAWN analysis: The network illustrates the relationship of clusters, with node indicating the degree of disease association (z-score scale) and node size reflecting cluster size (number of categories).
With categorized variants, risk score analysis identifies categories that predict disease phenotypes (Fig. 1D). The predictive contribution of each category is assessed by a Lasso regression model using the category patterns of each sample. In risk score analysis, feature selection is conducted to select phenotype-relevant datasets with positive model performance (R2) for further analyses. Subsequently, burden shift analysis identifies overrepresented annotations in category-level association tests (Fig. 1E). The significant excess of association compared to the null distribution suggests disease risk. Comparing results from both analyses assesses signal concordance, yielding candidate categories for disease association and subsequent Detecting Association With Networks (DAWN) analysis. Furthermore, CWAS-Plus provides a reliable method (Fig. 1F) to determine the number of effective tests. By treating highly correlated categories as a single effective test, it facilitates an accurate estimation of the study’s wide significance. In DAWN analysis, categories are clustered and investigated for associations with disease risk (Fig. 1G). Based on the DAWN algorithm [29], CWAS-Plus constructs a network of clusters and evaluates disease risk considering nearby clusters, enhancing the identification of variants with risk. Significant clusters yield RNVs, potential pathogenic variants with noncoding associations. To illustrate the overall workflow, we present a toy example showing a simple schematic view and the order of major computation steps in CWAS-Plus (Supplementary Fig. 1).
The CWAS-Plus pipeline, described above, receives a list of variants as input and comprises seven steps to assess the noncoding association. We performed variant-level analysis using de novo variants from 7280 samples in ASD families. Additionally, sample-level analyses utilized rare variants from 1087 WGS samples in the ROSMAP [32].
Performance improvements in CWAS-Plus
CWAS-Plus offers several advantages over CWAS [24] (Table 1), owing to its transformation into a user-friendly Python package with simplified source code. Researchers can easily employ its capabilities through straightforward parameter settings. The reorganization of the source code improves comprehensibility as well as enables streamlined multiprocessing, resulting in shorter processing times.
Table 1.
Comparison of CWAS-Plus and CWAS.
| CWAS | CWAS-Plus | |
|---|---|---|
| RAM | ≥16 GB | ≥16 GB |
| Total execution time | 142 h | 170 min |
| Programming language | R, Python2 | Python3 |
| Packaging | No | Yes |
| Multiprocessing | Yes | Yes |
| Batching | No | Yes |
| Setting environment | n/a | Pip |
| Annotation harmonization support | No | Yes |
Both tests were conducted using 36 cores and 256 GB of memory.
n/a, not applicable.
We benchmarked the performance of CWAS-Plus and compared a run time between CWAS-Plus and CWAS [24]. We performed the CWAS analysis for de novo variants of ASD families using the CWAS-Plus package and our previous CWAS scripts (https://github.com/sanderslab/cwas). For this, we obtained the annotation (total 27 462 categories) and sample dataset (1902 ASD cases and 1902 unaffected controls) from the previous study [24] and evaluated the comparison using the same computing resource (36 CPU threads and 256 GB of memory). CWAS-Plus was 50 times faster than CWAS, highlighting its superior computational speed (Fig. 2A, Supplementary Table 1).
Figure 2.

Benchmarking of CWAS-Plus. (A) Comparison of run time between CWAS [24] and CWAS-Plus. Run time was measured using identical annotation datasets and computing resources (3804 samples, 27 462 categories). The y-axis shows each CWAS-Plus step, the x-axis shows run time (h), and numbers next to bars indicate run time per step. (B) Regression line showing execution time with increasing sample size. Dots are observed times, colors represent CWAS-Plus processes, and the gray shade is the confidence interval. (C) Regression line showing execution time with increasing category number. Dots are observed times, colors represent CWAS-Plus processes, and the gray shade is the confidence interval. (D) t-SNE plots displaying the clustered features from random variant clustering and correlation clustering methods. (E) Distribution of the number of categories within each cluster using random variant and correlation clustering methods. The y-axis shows the number of categories per cluster. (F) Comparison of clusters from random variant clustering to correlation clustering. The y-axis shows random variant clusters, the x-axis shows types of differentiation (convergence, divergence, concordant). Convergence/divergence indicates merging/splitting of clusters; concordant indicates alignment of clusters. (A–C) Overall application of CWAS and CWAS-Plus was performed with 36 CPUs and 256 GB RAM.
We further assessed the computational efficiency of CWAS-Plus by examining its CPU and memory usage. We observed that CWAS-Plus operates efficiently with a single CPU, leading to reasonable execution times. For datasets with <27 000 categories, CWAS-Plus was sufficient with <16 GB of RAM, highlighting efficient memory usage. The scalability of the CWAS-Plus package was tested for run with an increasing number of samples (Fig. 2B, Supplementary Table 2) and datasets (Fig. 2C, Supplementary Table 3). The results revealed a linear increase in execution time with each additional 400 samples, requiring 15 min. Similarly, adding a new functional annotation increased the time by ~6 min. Additionally, we examined the memory usage of CWAS-Plus with an increasing number of samples and found an approximately linear increase (Supplementary Fig. 2). Collectively, these results demonstrated that CWAS-Plus exhibits linear scalability with data size. Notably, CWAS-Plus can handle over 27 000 comparisons with ~4000 samples in 3 h, highlighting its efficiency.
CWAS-Plus also provides an efficient approach to finding the number of effective tests for multiple testing corrections. To accomplish this, CWAS [24] utilized 10 000 sets of random variants. The P-values of the association tests, calculated from each variant set, were then used to measure the correlation between tests (categories). Considering that each variant set requires the same amount of time and memory resources for a single CWAS-Plus execution, this analysis incurs substantial computational costs. Regarding this issue, CWAS-Plus offers a correlation-based method, saving substantial time compared to the former. Both methods cluster categories based on correlation values, yet the correlation-based method calculates the correlation using the number of variants (or samples, in sample-level analysis) shared between two categories. Therefore, the method is fast and effective.
For validation, we compared the outcomes from both methods (Fig. 2D). We observed that the number of clusters in random variant clustering (n = 2477) was greater than that in correlation clustering (n = 1477). Additionally, we found a higher prevalence of larger clusters (more categories per cluster) in correlation clustering than in random variant clustering (Fig. 2E). These observations collectively suggest that small clusters in random variant clustering may merge into a single cluster within the correlation clustering approach.
Subsequently, we examined whether multiple clusters from random variant clustering (random variant cluster) converged to a larger cluster in correlation clustering (correlation cluster). Quantifying cluster similarities identified three scenarios: converged, diverged, and concordant. The converged clusters, wherein multiple random variant clusters merged into a single correlation cluster, constituted 67.1% of all random variant clusters (Fig. 2F). Conversely, the diverged clusters, in which a random variant cluster split into multiple correlation clusters, accounted for 18.4%. This observation implies that, in most instances, random variant clusters converged toward a single correlation cluster.
Taken together, these results indicate that the number of correlation clusters is smaller than that of random clusters because random clusters merge into correlation clusters. However, the composition of categories within each cluster remains fairly similar, as correlation clusters absorb small random clusters. Overall, our results demonstrate that the correlation-based method effectively replaces the utilization of random variant sets, considerably reducing computational time and memory usage.
Application of CWAS-Plus to regulatory association in cell-type-specific functional data
Ongoing efforts have been made to generate various annotation datasets for functional regions in the noncoding genome or regulatory enhancers of various cell types and tissues. CWAS-Plus facilitates CWAS analysis by incorporating a new annotation dataset and seeking an appropriate multiple comparison level. Here, we performed the CWAS analyses for de novo variants in ASD cases (n = 4354) and their unaffected siblings (n = 2926) and examined noncoding associations of ASD in cell-type-specific regulatory elements. For this, we obtained various functional datasets, including single-nucleus ATAC-seq (snATAC-seq) datasets [3, 38–40] from early developmental stages of the human brain (a total of 111 annotation datasets) (Fig. 3A).
Figure 3.

Noncoding association with ASD in cell-type-specific regulatory elements. (A) Summary of annotations for the CWAS analysis for ASD. Created with BioRender.com. (B) Risk score analysis noncoding genomic regions using Lasso regression model. The x-axis shows model performance (R2). Asterisks indicate permuted P-values (*, P < 5.0  10−2; **, P < 1.0
  10−2). Bars indicate whether feature selection was applied. (C) Burden shift analysis results for intergenic and 5′ UTR categories. Density plots represent the null distribution. Vertical lines show observed significant tests for cases and controls. (D) DAWN analysis results for intergenic categories. Each dot represents a cluster, with disease association shown by normalized z-scores. Node size indicates the number of categories in a cluster. Edges represent P-value correlation between clusters. Thick borders indicate clusters with FDR < 5.0
  10−2. (E) Correlations between clusters and single annotations. Degree of correlation between clusters and single annotations is shown. Thick boxes highlight highly correlated annotations. (F) Enrichment analysis results with transcription factors. Significance indicated by asterisks (FDR < 5.0
  10−2). Boxes show odds ratio. (G) Comparison of the percentage of transcription factors in genes affected by RNVs and non-RNVs. Portions of transcription factors and others are shown. (H) Protein–protein interaction network of genes in transcription regulation pathway and also carry RNV or PTV. Node shapes indicate transcription factors (triangles) or others (circles). Node sizes show odds ratio, and the type of variants carried by the gene are represented.
Our CWAS analysis generated 142 498 categories for burden testing. As none of the noncoding categories exhibited study-wide significance (P < 1.4 × 10⁻⁵), we applied risk score analysis to measure noncoding associations from multiple categories of each genomic region. The results showed that noncoding, including intergenic (R2 = 0.20%, P = 1.3  10−2; Supplementary Tables 4 and 5) and 5’ UTR (R2 = 0.15%, P = 1.1
  10−2), categories were significantly enriched (Fig. 3B). The performances were prominent after feature selection, indicating its necessity for enhancing model performance. We also performed burden shift analysis and found case-enrichment in intergenic categories (P = 1.0
  10−4), supporting the association found from risk score analysis (Fig. 3C).
We further explored intergenic variants through DAWN analysis, aiming to identify subnetworks within categories and find risk variants. Leveraging the correlations between categories, a network of intergenic categories was constructed (Fig. 3D). We identified eight clusters associated with ASD (FDR < 5.0  10−2). Clusters of constrained loci, conserved loci, and ASD-associated transcriptional regulator binding sites were densely connected, offering insights into the potential regulatory connections governing these loci.
To examine cluster characteristics, we identified annotation datasets correlated with the clusters. The results revealed cell-type-specificity in clusters 50, 60, and 42, where the former two clusters were highly correlated with medial ganglionic eminence-derived cells and the latter correlated with astrocytes (Fig. 3E). By contrast, cluster 19 was specific to binding sites targeted by ASD-associated transcriptional regulators [41]. As shown in clusters 19 and 42, ASD associations were also found in evolutionarily conserved elements and regulatory elements specific to fetal brains, consistent with previous findings [42–44]. The results also provided shared features among datasets at the variant level. Specifically, excitatory neuron-CREs (CREs) in early stages were grouped, suggesting more specificity compared to late stages.
We defined variants within significant clusters as RNVs. To validate our results, we utilized a deep-learning prediction tool, Sei [35], to assess the regulatory activities of RNVs. Our observations revealed that variants from most clusters exhibited a higher percentage of variants in higher score bins than non-RNVs (Supplementary Fig. 3), indicating that CWAS-Plus prioritized more pathogenic variants within the broader pool of noncoding variants.
While investigating the role of RNVs in ASD, we hypothesized that RNVs may not only affect the binding sites of transcription factors but also affect transcription factors themselves, thereby disrupting transcriptional regulation. We utilized a list of human transcription factors [34] to conduct enrichment analysis on both RNV-affected and non-RNV-affected genes. The results demonstrated significant enrichment in RNV-affected genes across most clusters compared to that in other noncoding variants (Fig. 3F). Additionally, the transcription factors [34] showed five-fold enrichment in RNVs compared to non-RNVs (Fig. 3G), indicating the disruptive influence on gene expression through interference with transcription factor activity.
To understand the regulatory network affected by RNVs, we constructed a protein–protein interaction network involving genes affected by both RNVs and PTVs (Fig. 3H). This network specifically focused on genes involved in transcription regulation. Genes with a high OR for carrying de novo variants in ASD cases (OR > 2) showed associations with neurodevelopmental risk. For example, NCKAP1, crucial for neuronal differentiation, is implicated in ASD and neurodevelopmental delay [45, 46]. Additionally, CDKN1C, exclusively pinpointed by RNVs, was previously reported as a neurodevelopmental risk gene [46]. These findings support the reliability of our analyses, providing insights into potential associations of risk genes regulated by noncoding variants.
Furthermore, we evaluated the advancements of CWAS-Plus in prioritizing disease-specific risk variants by comparing it with other noncoding analysis tools: Sei [35], Enformer [36], and STAARpipeline [22]. Using the same de novo variants as in Fig. 3, we compared the OR of variant carriers in case–control samples. CWAS-Plus demonstrated significant case enrichment (OR = 1.3; P = 5.7  10−3, 95% CI: 1.1–1.6), while Sei, Enformer, and STAARpipeline showed no significant case enrichment (Supplementary Fig. 4, Supplementary Table 6). These results suggest that CWAS-Plus excels in identifying phenotype-specific variants compared to other tools, highlighting its advantages in analyzing disease associations in noncoding variants.
Application of CWAS-Plus to sample-level analysis of rare variants associated with Alzheimer’s disease
While the CWAS framework was mainly developed to test noncoding associations for de novo variants, it can be applied to rare variants [23]. For burden tests, the CWAS-Plus package provides a ‘sample-level test’, estimating case–control association by comparing the number of samples carrying rare variants in each category (Fig. 1C). Unlike de novo variants, the number of rare variants is highly variable across individuals due to different genetic backgrounds, potentially leading to spurious genetic associations with the variant-level test. Thus, the CWAS analysis for rare variants should be performed using the sample-level test to yield robust signals.
We evaluated the performance and reproducibility of the sample-level test results against the variant-level test using de novo variants. CWAS analyses for de novo variants showed highly consistent estimates between the variant-level and sample-level tests (Supplementary Fig. 5, Supplementary Table 7). Given these results, we infer that sample-level tests similarly capture associations as variant-level tests.
With the objective of demonstrating the ability of CWAS-Plus to assess noncoding risk in other genomic disorders, we applied the sample-level test to rare variants in 734 AD cases and 353 controls from ROSMAP WGS data. Annotation datasets included AD-specific CREs [47] and differentially expressed genes from single-cell data [48]. Among 56 728 categories, none reached study-wide significance (P < 4.9  10−5). Since no single category fully explained AD risk associated with rare noncoding variants, we conducted a risk score analysis to identify predictors among diverse categories (Fig. 4A, Supplementary Tables 8 and 9). Noncoding categories, including intergenic (R2 = 1.26%, P = 4.3
  10−2), intron (R2 = 1.67%, P = 3.8
  10−2), and 3’ UTR (R2 = 1.51%, P = 7.0
  10−3), were significant, suggesting potential AD risk in these categories.
Figure 4.

Application of CWAS-Plus to rare variants in Alzheimer’s disease. (A) Risk score analysis results of noncoding genomic regions. The x-axis indicates the model performance (R2) obtained from the lasso regression model. The asterisks indicate permutated p-values (*, P < 5.0  10−2; **, P < 1.0
  10−2). (B) DAWN analysis results with 3′ UTR categories. Each dot represents a single cluster. The degree of disease association is shown by the color of clusters scaled with normalized z-scores. The node size indicates the number of categories within a cluster. The edge refers to the P-value correlation between clusters. The thick borderline indicates clusters with FDR < 5.0
  10−2. (C) Correlations between clusters and single annotations. The degree of correlation is shown by color. (D) Genes recurrent in RNVs. The x-axis indicates the odds ratio in a log2 scale. The circle size shows the number of AD cases.
Focusing on 3′ UTR variants, we applied DAWN analysis and found six significant clusters (FDR < 5.0 10−2), defining variants in the cluster as RNVs for AD (Fig. 4B). To delineate the distinctive features of this cluster, we identified single annotations highly correlated with the clusters (Fig. 4C). The clusters showed enrichment with microglia-specific CREs and constrained loci, indicating the regulatory roles of RNVs in microglia-specific pathways. The microglia signals underscore the robustness of CWAS analysis, given the well-established disruption of neuroinflammatory pathways in AD pathology [49].
We evaluated gene recurrence in 705 cases with RNVs, identifying 82 genes in more than five AD cases (OR > 1) and providing a candidate list for AD risk genes regulated by RNVs (Fig. 4D). Among these, SMPD3 emerged as a significant recurrent risk gene [OR = Inf; P = 2.0  10−2, 95% confidence interval (95% CI): 1.2–Inf]. SMPD3 encodes the enzyme neutral sphingomyelinase-2, which is significantly reduced in AD cases [50]. Deficiency of SMPD3 disrupts Golgi lipid remodeling, leading to the accumulation of neurotoxic proteins (APP, Aβ, and pTau), dysproteostasis, and cognitive impairment [51]. Furthermore, SMPD3 regulates exosome production, which is essential for tau propagation [52]. Inhibiting SMPD3 reduces tau spread, highlighting its potential as a therapeutic target for AD.
Additionally, we identified SCD as a significant recurrent gene in AD (OR = Inf; P = 2.0  10−2, 95% CI: 1.2–Inf). SCD encodes stearoyl-CoA desaturase, a key enzyme in fatty acid metabolism. SCD is pivotal in AD pathogenesis by regulating lipid metabolism, immune responses, and synaptic functions [53]. Inhibition of SCD has demonstrated restoration of synaptic density and structure, reduction of microglial activation, and improvement in cognitive outcomes in AD models, positioning it as a promising therapeutic target for AD. These findings validate CWAS-Plus in capturing reliable signals from rare variants and provide insights into potential therapeutic targets.
Utilizing large annotation datasets improves model performance in risk score analysis
One of the key questions in risk score analysis is whether adding more annotation datasets enhances the model’s performance. We compared three sets of annotation datasets: set 1, set 2, and set 3 (Fig. 5A). Set 3 corresponds to the initial annotation dataset from Fig. 3A (286 functional annotations and scores; 142 498 categories). Sets 1 and 2 share the same datasets as set 3 but differ in functional annotations. Set 1 includes CREs from Herring et al. [3] (20 functional annotations and scores; 48 680 categories), while set 2 expands from set 1 by adding regulatory elements from the Roadmap Epigenomics project [54] and VISTA [55], and binding sites for ASD-associated transcription regulators [41] (274 functional annotations and scores; 69 702 categories).
Figure 5.

Improved model performance with expanded annotation datasets. (A) A schematic view of three annotation datasets with increasing size. The number of categories is denoted in each set. (B) Model performance of categories from each genomic region in each set from (A). The colors correspond to genomic regions, and the size of data points reflects the number of categories.
The introduction of additional regulatory elements improved the model’s performance within noncoding categories. Set 3 showed the highest performance, outperforming set 1, followed by set 2 (R2 = 0.08%, P = 5.5  10−1 for set 1; R2 = 0.17%, P = 4.3
  10−1 for set 2; R2 = 0.33%, P = 3.7
  10−1 for set 3; Fig. 5B, Supplementary Table 10). While certain genomic regions, such as 5′ UTRs, exhibited improved model performance compared to set 1, others, like 3′ UTRs, demonstrated a decrease. These observations emphasize the importance of not only increasing the quantity of annotations but also the composition of the added features to enhance the performance.
Discussion and conclusion
In this study, we introduce CWAS-Plus, a tool for efficient CWAS analysis to identify noncoding associations from WGS data. The package supports user-friendly functions for categorization and burden enrichment tests for various functional datasets. Our tool facilitates the identification of the number of effective tests across multiple tested categories for multiple testing corrections. Consequently, it is applicable to WGS studies of various human disorders.
Here, we integrated multiple functional datasets, including snATAC-seq datasets from the human cortex, for CWAS analysis of de novo variants in ASD families, demonstrating cell-type-specific context for noncoding association. Significant associations were observed in intergenic categories enriched with regulatory regions of fetal brains and binding sites of ASD-associated transcription regulators. These results suggested that RNVs may contribute to ASD neurobiology by disrupting transcription factors during fetal brain development. Moreover, consistent with our previous finding [24], RNVs were highly correlated with sequence conservation, indicating ASD noncoding association for regulatory elements with evolutionary conservation. Overall, CWAS-Plus enables the integration of accumulated functional datasets with WGS data, thereby facilitating the identification of novel associations between regulatory elements and noncoding variants.
Our extended analysis comparing the ability to identify risk variants revealed that only CWAS-Plus demonstrated significant case enrichment in risk variant carriers, whereas Sei, Enformer, and STAARpipeline did not (Supplementary Fig. 4). This discrepancy may be due to the lack of phenotype consideration, and the limited scope of single-cell and disease-relevant datasets in pretrained models of deep learning tools. While retraining models with custom datasets could enhance accuracy, it is computationally intensive. CWAS-Plus addresses these limitations by integrating multiple functional datasets, including single-cell regulatory datasets, in a time-efficient manner.
STAARpipeline, which also considers phenotype information and utilizes multiple functional datasets, focuses on narrowly defined regions with gene-centric testing and sliding window analysis. The sparse de novo variants and extensive multiple testing burden in the STAARpipeline led to no significant associations, as the tests did not meet genome-wide significance. In contrast, CWAS-Plus’s comprehensive approach allows it to identify risk variants with smaller effects by aggregating associations across diverse categories and regulatory elements throughout the genome.
CWAS-Plus provides a novel approach to assessing the genome-wide significance of rare noncoding variants. Unlike GWAS, which estimates effective association tests based on locus correlation, CWAS-Plus addresses the absence of standardized criteria for closely related association tests in rare variants by introducing a method to calculate associations between tests (categories). This unique methodology enables CWAS-Plus to conduct correction for multiple hypothesis testing, providing a tailored significance threshold for rare variants.
CWAS-Plus offers a comprehensive approach to perform analyses at both the variant-level and sample-level. De novo variants occur at a relatively consistent rate across individuals. By contrast, rare variants show higher variability in occurrence rates due to genetic ancestry. CWAS-Plus considers these characteristics and provides both variant- and sample-level tests, allowing its application to de novo and rare variants effectively. Applying CWAS-Plus to rare variants of the AD cohort, despite the limited sample size, revealed potential risks associated with 3′ UTR variants in microglia-specific CREs. These results are consistent with previous findings where microglia-expressed genes were enriched with candidate causal genes found in GWAS [56–58]. Taken together, our findings emphasize the reliability of CWAS-Plus and support the applicability to rare variants and complex genomic disorders, such as AD.
Despite various advantages, our package has a few limitations. CWAS-Plus enables users to customize annotation datasets for their phenotype of interest. However, the degree of freedom may pose challenges for diseases for which there is no access to relevant datasets or clear hypotheses for constructing customized categories. To address this issue, we provide datasets, such as putative promoter and enhancer regions, as a baseline to facilitate a more accessible starting point. Moreover, CWAS-Plus offers feature selection to select phenotype-relevant datasets, refining annotation dataset composition. Furthermore, CWAS-Plus has significantly improved computational speed; however, computation testing at a cohort level with hundreds of thousands of samples has not yet been carried out. Continuous development efforts will be undertaken to overcome these limitations of CWAS-Plus.
In summary, we present CWAS-Plus, a Python package for performing genome-wide assessments of noncoding associations. CWAS-Plus offers an efficient and user-friendly approach for integrating functional datasets with large-scale WGS data and empowers multiple testing comparisons. Our package is applicable to both de novo and rare variants. In future studies, we aim to optimize resource usage for efficient execution, especially in environments with limited memory and computing power. We also plan to utilize additional functional datasets to enhance the identification of regulatory signals, such as topologically associating domains and 3D chromatin interaction datasets. Additionally, we will extend the applicability of CWAS-Plus to various fields, facilitating the exploration of noncoding associations in diverse diseases such as cancers. With CWAS-Plus, we expect to uncover novel noncoding associations and enhance our understanding of genetic contributions to pathologies.
Key Points
CWAS-Plus efficiently identifies noncoding associations in WGS data, supporting user-friendly categorization and burden enrichment tests.
CWAS-Plus integrates various functional datasets, emphasizing cell-type-specific noncoding associations.
CWAS-Plus provides a novel approach for multiple testing correction, enhancing the reliability of the results.
Autism spectrum disorder risk noncoding variants are identified as enriched with transcription factors, suggesting their role in the pathology.
Rare variant analysis with Alzheimer’s disease samples reveals strong a association with microglia, supporting the reliability of the results produced by CWAS-Plus.
Supplementary Material
Acknowledgements
We are grateful to all of the families at the participating Simons Simplex Collection (SSC) sites, as well as the principal investigators (A. Beaudet, R. Bernier, J. Constantino, E. Cook, E. Fombonne, D. Geschwind, R. Goin-Kochel, E. Hanson, D. Grice, A. Klin, D. Ledbetter, C. Lord, C. Martin, D. Martin, R. Maxim, J. Miles, O. Ousley, K. Pelphrey, B. Peterson, J. Piggot, C. Saulnier, M. State, W. Stone, J. Sutcliffe, C. Walsh, Z. Warren, and E. Wijsman). We appreciate obtaining access to phenotypic and genetic data on SFARI Base. Approved researchers can obtain the SSC population dataset described in this study by applying at https://base.sfari.org. We also thank the participants in the Religious Order Study, the Memory and Aging Project (ROSMAP). The results published here are in whole or in part based on data obtained from the AD Knowledge Portal (https://adknowledgeportal.org). Study data were provided by the Rush Alzheimer’s Disease Center, Rush University Medical Center, Chicago. Data collection was supported through funding by NIA grants P30AG10161 (ROS), R01AG15819 (ROSMAP; genomics and RNAseq), R01AG17917 (MAP), R01AG30146, U01AG32984 (genomic and whole exome sequencing), U01AG46152 (ROSMAP AMP-AD, targeted proteomics), U01AG61356 (whole genome sequencing, targeted proteomics, ROSMAP AMP-AD), the Illinois Department of Public Health (ROSMAP), and the Translational Genomics Research Institute (genomic). Additional phenotypic data can be requested at www.radc.rush.edu.
Author Biographies
Yujin Kim is a graduate student at Korea University, where she focuses on studying noncoding variants that disrupt enhancers implicated in autism and developing a statistical method for the genetic association of rare variants from whole-genome sequencing data.
Minwoo Jeong worked as a research assistant with a particular interest in developing bioinformatic methods for large-scale whole-genome sequencing projects.
In Gyeong Koh a graduate student at Korea University, is currently engaged in developing a single-cell sequencing atlas and data integration methods for various human brain transcriptome studies.
Chanhee Kim is a graduate student at Korea University studying rare noncoding variants in Alzheimer’s disease using category-wide association techniques and applying them to large-scale whole-genome sequencing studies of Alzheimer’s disease.
Hyeji Lee is a graduate student at Korea University and focuses on studying rare inherited variants in autism and neurodegenerative disorders.
Jae Hyun Kim formerly a graduate student at Korea University, conducted research on noncoding structural variants in autism using whole-genome sequencing datasets.
Ronald Yurko is an assistant teaching professor in the Department of Statistics & Data Science at Carnegie Mellon University. Dr. Yurko is interested in developing methods at the interface of inference and machine learning, particularly oriented toward problems in statistical genetics and genetic association studies.
Il Bin Kim a professor at the Department of Psychiatry, CHA University School of Medicine, is dedicated to psychiatric genetics and the identification of promoter-enhancer interactions in the noncoding genome from a whole-genome sequencing study of Korean autism families (Kim et al., 2022, Molecular Psychiatry).
Jeongbin Park an assistant professor at the School of Biomedical Convergence Engineering, Pusan National University, focuses on developing machine learning and probabilistic tools for various genomic studies and has contributed to the development of various packages for single-cell analysis.
Donna M. Werling an assistant professor at the University of Wisconsin-Madison, conducts research on genetic risk factors for autism and other neuropsychiatric conditions, as well as sex differences in neurobiology and disease risk. Dr. Werling has developed bioinformatics tools, including the category-wide association test, for large-scale whole-genome sequencing studies (Werling et al., 2018, Nature Genetics) and identified regulatory noncoding variants associated with human cortical development (Werling et al., 2020, Cell Reports).
Stephan J. Sanders a professor at the Department of Paediatrics, University of Oxford, and the Department of Psychiatry and Behavioral Sciences, University of California, San Francisco, is renowned for his landmark studies on de novo variants in autism (Sanders et al., 2012, Nature), autism-associated genes (Sanders et al., 2015, Neuron), and noncoding risk mutations in autism (An et al., 2018, Science).
Joon-Yong An an associate professor at the Department of Biosystem and Biomedical Science at Korea University, has been dedicated to autism genetics and large-scale whole-genome sequencing analysis. Dr. An introduced the category-wide association test method for whole-genome sequencing studies (Werling et al., 2018) and identified noncoding risk mutations in autism (An et al., 2018, Science).
Contributor Information
Yujin Kim, Department of Integrated Biomedical and Life Science, Korea University, 145 Anam-ro, Seongbuk-ku, Seoul 02841, Republic of Korea; L-HOPE Program for Community-Based Total Learning Health Systems, Korea University, 145 Anam-ro, Seongbuk-ku, Seoul 02841, Republic of Korea.
Minwoo Jeong, School of Biosystem and Biomedical Science, College of Health Science, Korea University, 145 Anam-ro, Seongbuk-ku, Seoul 02841, Republic of Korea.
In Gyeong Koh, Department of Integrated Biomedical and Life Science, Korea University, 145 Anam-ro, Seongbuk-ku, Seoul 02841, Republic of Korea; L-HOPE Program for Community-Based Total Learning Health Systems, Korea University, 145 Anam-ro, Seongbuk-ku, Seoul 02841, Republic of Korea.
Chanhee Kim, Department of Integrated Biomedical and Life Science, Korea University, 145 Anam-ro, Seongbuk-ku, Seoul 02841, Republic of Korea; L-HOPE Program for Community-Based Total Learning Health Systems, Korea University, 145 Anam-ro, Seongbuk-ku, Seoul 02841, Republic of Korea.
Hyeji Lee, Department of Integrated Biomedical and Life Science, Korea University, 145 Anam-ro, Seongbuk-ku, Seoul 02841, Republic of Korea; L-HOPE Program for Community-Based Total Learning Health Systems, Korea University, 145 Anam-ro, Seongbuk-ku, Seoul 02841, Republic of Korea.
Jae Hyun Kim, Department of Integrated Biomedical and Life Science, Korea University, 145 Anam-ro, Seongbuk-ku, Seoul 02841, Republic of Korea; L-HOPE Program for Community-Based Total Learning Health Systems, Korea University, 145 Anam-ro, Seongbuk-ku, Seoul 02841, Republic of Korea.
Ronald Yurko, Department of Statistics and Data Science, Carnegie Mellon University, 5000 Forbes Avenue, Squirrel Hill North, Pittsburgh, PA 15213, United States.
Il Bin Kim, Department of Psychiatry, CHA Gangnam Medical Center, CHA University School of Medicine, 566 Nonhyon-ro, Gangnam-gu, Seoul 06135, Republic of Korea.
Jeongbin Park, School of Biomedical Convergence Engineering, Pusan National University, 49 Busandaehak-ro, Mulgeum-eup, Yangsan-si, Gyeongsangnam-do, 50612, Republic of Korea.
Donna M Werling, Laboratory of Genetics, University of Wisconsin-Madison, 425-g Henry Mall, Madison, WI 53706, Unite States.
Stephan J Sanders, Department of Paediatrics, Institute of Developmental and Regenerative Medicine, University of Oxford, Old Road Campus, Roosevelt Dr, Headington, Oxford OX3 7TY, United Kingdom; Department of Psychiatry and Behavioral Sciences, UCSF Weill Institute for Neurosciences, University of California, 1651 4th Street, San Francisco, CA 94158, United States.
Joon-Yong An, Department of Integrated Biomedical and Life Science, Korea University, 145 Anam-ro, Seongbuk-ku, Seoul 02841, Republic of Korea; L-HOPE Program for Community-Based Total Learning Health Systems, Korea University, 145 Anam-ro, Seongbuk-ku, Seoul 02841, Republic of Korea; School of Biosystem and Biomedical Science, College of Health Science, Korea University, 145 Anam-ro, Seongbuk-ku, Seoul 02841, Republic of Korea.
Funding
This study was supported by grants from the National Research Foundation (NRF) of Korea (NRF-2020R1C1C1003426 and NRF-2021M3E5D9021878 to J.-Y.A; NRF-2021M3A9E4080784 to I.B.K.), the Korea Health Technology R&D Project through the Korea Health Industry Development Institute and Korea Dementia Research Center, funded by the Ministry of Health & Welfare and Ministry of Science and ICT, Republic of Korea (grant number: HU22C0042), and Korea University (to J.-Y.A.), SFARI (#606289 to D.M.W.), and the Brain and Behavior Research Foundation (BBRF, #29815 to D.M.W.). This work was supported by the Korea Bio Data Station with computing resources including technical support. Y.K., I.G.K., H.L., and J.H.K. received a scholarship from the Brain Korea FOUR education program. Y.K. received a scholarship from the Seoul Broadcasting System foundation scholarship program.
Data availability
The source code of CWAS-Plus is available via a GitHub repository (https://github.com/joonan-lab/cwas/) and Zenodo (https://doi.org/10.5281/zenodo.10795678) [59], with a user manual (https://cwas-plus.readthedocs.io/en/latest/). Both repositories are released under the MIT license. The scripts to produce the annotation dataset, along with the burden test results from the CWAS analyses conducted in this study, are available via Zenodo (https://doi.org/10.5281/zenodo.11240547) [60]. The Zenodo repository is released under the Creative Commons Attribution 4.0 International license. CWAS-Plus is written in Python (version  3.9), and is easy to install and use on Linux or Mac OS.
De novo variants were obtained from the pVCF file, accessible with approval from the Simons Foundation Autism Research Initiative (SFARI Base; https://sfari.org/resources/sfari-base). ROSMAP WGS data can be requested at the AD Knowledge Portal under accession code syn10901595 (https://www.synapse.org/#!Synapse:syn10901595; see https://adknowledgeportal.synapse.org/Data%20Access for data access instructions).
Author contributions
Study design: Y.K., M.J., R.Y., D.W., K.R., B.D., S.S., and J.-Y.A. Data processing: Y.K., I.G.K., and H.L. Data analysis: Y.K. Package development: Y.K., M.J., I.G.K., J.H.K., S.S., and J.-Y.A. Manuscript preparation: Y.K., I.G.K., and J.-Y.A. Supervision: S.S., D.W., J.P., I.B.K., and J.-Y.A. All authors have read and approved the final draft of the manuscript for submission.
Ethics approval and consent to participate
Informed consent was obtained from all participants involved in the study by the Simons Foundation Autism Research Initiative (SFARI), and Religious Orders Study (ROS) and the Rush Memory and Aging Project (MAP). Data access and analyses were approved by the Institutional Review Board (IRB) of Korea University (approval number: KUIRB-2022-0409-03). The ROSMAP was approved by the IRB of Rush University Medical Center.
References
- 1. Visel A, Blow MJ, Li Zet al. ChIP-seq accurately predicts tissue-specific activity of enhancers. Nature 2009;457:854–8. 10.1038/nature07730 [DOI] [PMC free article] [PubMed] [Google Scholar]
- 2. Wu H, Nord AS, Akiyama JAet al. Tissue-specific RNA expression marks distant-acting developmental enhancers. PLoS Genet 2014;10:e1004610. 10.1371/journal.pgen.1004610 [DOI] [PMC free article] [PubMed] [Google Scholar]
- 3. Herring CA, Simmons RK, Freytag Set al. Human prefrontal cortex gene regulatory dynamics from gestation to adulthood at single-cell resolution. Cell 2022;185:4428–4447.e28. 10.1016/j.cell.2022.09.039 [DOI] [PubMed] [Google Scholar]
- 4. Cao J, O'Day DR, Pliner HAet al. A human cell atlas of fetal gene expression. Science 2020;370:eaba7721. 10.1126/science.aba7721 [DOI] [PMC free article] [PubMed] [Google Scholar]
- 5. Soldner F, Stelzer Y, Shivalila CSet al. Parkinson-associated risk variant in distal enhancer of alpha-synuclein modulates target gene expression. Nature 2016;533:95–9. 10.1038/nature17939 [DOI] [PMC free article] [PubMed] [Google Scholar]
- 6. Vacic V, McCarthy S, Malhotra Det al. Duplications of the neuropeptide receptor gene VIPR2 confer significant risk for schizophrenia. Nature 2011;471:499–503. 10.1038/nature09884 [DOI] [PMC free article] [PubMed] [Google Scholar]
- 7. Bae BI, Tietjen I, Atabay KDet al. Evolutionarily dynamic alternative splicing of GPR56 regulates regional cerebral cortical patterning. Science 2014;343:764–8. 10.1126/science.1244392 [DOI] [PMC free article] [PubMed] [Google Scholar]
- 8. Maurano MT, Humbert R, Rynes Eet al. Systematic localization of common disease-associated variation in regulatory DNA. Science 2012;337:1190–5. 10.1126/science.1222794 [DOI] [PMC free article] [PubMed] [Google Scholar]
- 9. Schaub MA, Boyle AP, Kundaje Aet al. Linking disease associations with regulatory information in the human genome. Genome Res 2012;22:1748–59. 10.1101/gr.136127.111 [DOI] [PMC free article] [PubMed] [Google Scholar]
- 10. Hindorff LA, Sethupathy P, Junkins HAet al. Potential etiologic and functional implications of genome-wide association loci for human diseases and traits. Proc Natl Acad Sci U S A 2009;106:9362–7. 10.1073/pnas.0903103106 [DOI] [PMC free article] [PubMed] [Google Scholar]
- 11. Watanabe K, Stringer S, Frei Oet al. A global overview of pleiotropy and genetic architecture in complex traits. Nat Genet 2019;51:1339–48. 10.1038/s41588-019-0481-0 [DOI] [PubMed] [Google Scholar]
- 12. Ritchie GR, Dunham I, Zeggini Eet al. Functional annotation of noncoding sequence variants. Nat Methods 2014;11:294–6. 10.1038/nmeth.2832 [DOI] [PMC free article] [PubMed] [Google Scholar]
- 13. Fu Y, Liu Z, Lou Set al. FunSeq2: a framework for prioritizing noncoding regulatory variants in cancer. Genome Biol 2014;15:480. 10.1186/s13059-014-0480-5 [DOI] [PMC free article] [PubMed] [Google Scholar]
- 14. Kircher M, Witten DM, Jain Pet al. A general framework for estimating the relative pathogenicity of human genetic variants. Nat Genet 2014;46:310–5. 10.1038/ng.2892 [DOI] [PMC free article] [PubMed] [Google Scholar]
- 15. Huang YF, Gulko B, Siepel A. Fast, scalable prediction of deleterious noncoding variants from functional and population genomic data. Nat Genet 2017;49:618–24. 10.1038/ng.3810 [DOI] [PMC free article] [PubMed] [Google Scholar]
- 16. Zhang S, He Y, Liu Het al. regBase: whole genome base-wise aggregation and functional prediction for human non-coding regulatory variants. Nucleic Acids Res 2019;47:e134. 10.1093/nar/gkz774 [DOI] [PMC free article] [PubMed] [Google Scholar]
- 17. Ionita-Laza I, McCallum K, Xu Bet al. A spectral approach integrating functional genomic annotations for coding and noncoding variants. Nat Genet 2016;48:214–20. 10.1038/ng.3477 [DOI] [PMC free article] [PubMed] [Google Scholar]
- 18. Quang D, Chen Y, Xie X. DANN: a deep learning approach for annotating the pathogenicity of genetic variants. Bioinformatics 2015;31:761–3. 10.1093/bioinformatics/btu703 [DOI] [PMC free article] [PubMed] [Google Scholar]
- 19. Vitsios D, Dhindsa RS, Middleton Let al. Prioritizing non-coding regions based on human genomic constraint and sequence context with deep learning. Nat Commun 2021;12:1504. 10.1038/s41467-021-21790-4 [DOI] [PMC free article] [PubMed] [Google Scholar]
- 20. Liu Y, Liang Y, Cicek AEet al. A statistical framework for mapping risk genes from de novo mutations in whole-genome-sequencing studies. Am J Hum Genet 2018;102:1031–47. 10.1016/j.ajhg.2018.03.023 [DOI] [PMC free article] [PubMed] [Google Scholar]
- 21. He Z, Xu B, Buxbaum Jet al. A genome-wide scan statistic framework for whole-genome sequence data analysis. Nat Commun 2019;10:3018. 10.1038/s41467-019-11023-0 [DOI] [PMC free article] [PubMed] [Google Scholar]
- 22. Li Z, Li X, Zhou Het al. A framework for detecting noncoding rare-variant associations of large-scale whole-genome sequencing studies. Nat Methods 2022;19:1599–611. 10.1038/s41592-022-01640-x [DOI] [PMC free article] [PubMed] [Google Scholar]
- 23. Werling DM, Brand H, An JYet al. An analytical framework for whole-genome sequence association studies and its implications for autism spectrum disorder. Nat Genet 2018;50:727–36. 10.1038/s41588-018-0107-y [DOI] [PMC free article] [PubMed] [Google Scholar]
- 24. An JY, Lin K, Zhu Let al. Genome-wide de novo risk score implicates promoter variation in autism spectrum disorder. Science 2018;362:eaat6576. 10.1126/science.aat6576 [DOI] [PMC free article] [PubMed] [Google Scholar]
- 25. McLaren W, Gil L, Hunt SEet al. The Ensembl variant effect predictor. Genome Biol 2016;17:122. 10.1186/s13059-016-0974-4 [DOI] [PMC free article] [PubMed] [Google Scholar]
- 26. Kong A, Frigge ML, Masson Get al. Rate of de novo mutations and the importance of father's age to disease risk. Nature 2012;488:471–5. 10.1038/nature11396 [DOI] [PMC free article] [PubMed] [Google Scholar]
- 27. O'Roak BJ, Vives L, Girirajan Set al. Sporadic autism exomes reveal a highly interconnected protein network of de novo mutations. Nature 2012;485:246–50. 10.1038/nature10989 [DOI] [PMC free article] [PubMed] [Google Scholar]
- 28. Yurko R, Roeder K, Devlin Bet al. An approach to gene-based testing accounting for dependence of tests among nearby genes. Brief Bioinform 2021;22:bbab329. 10.1093/bib/bbab329 [DOI] [PMC free article] [PubMed] [Google Scholar]
- 29. Liu L, Lei J, Sanders SJet al. DAWN: a framework to identify autism genes and subnetworks using gene expression and genetics. Mol Autism 2014;5:22. 10.1186/2040-2392-5-22 [DOI] [PMC free article] [PubMed] [Google Scholar]
- 30. Fischbach GD, Lord C. The Simons simplex collection: a resource for identification of autism genetic risk factors. Neuron 2010;68:192–5. 10.1016/j.neuron.2010.10.006 [DOI] [PubMed] [Google Scholar]
- 31. pfeliciano@simonsfoundation.org SCEa, Consortium S . SPARK: a US cohort of 50,000 families to accelerate autism research. Neuron 2018;97:488–93. 10.1016/j.neuron.2018.01.015 [DOI] [PMC free article] [PubMed] [Google Scholar]
- 32. Bennett DA, Buchman AS, Boyle PAet al. Religious orders study and rush memory and aging project. J Alzheimers Dis 2018;64:S161–89. 10.3233/JAD-179939 [DOI] [PMC free article] [PubMed] [Google Scholar]
- 33.De Jager PL, Ma Y, McCabe C et al. A multi-omic atlas of the human frontal cortex for aging and Alzheimer's disease research. Sci Data 2018;5:180142. 10.1038/sdata.2018.142 [DOI] [PMC free article] [PubMed] [Google Scholar]
- 34. Lambert SA, Jolma A, Campitelli LFet al. The human transcription factors. Cell 2018;172:650–65. 10.1016/j.cell.2018.01.029 [DOI] [PubMed] [Google Scholar]
- 35. Chen KM, Wong AK, Troyanskaya OGet al. A sequence-based global map of regulatory activity for deciphering human genetics. Nat Genet 2022;54:940–9. 10.1038/s41588-022-01102-2 [DOI] [PMC free article] [PubMed] [Google Scholar]
- 36. Avsec Z, Agarwal V, Visentin Det al. Effective gene expression prediction from sequence by integrating long-range interactions. Nat Methods 2021;18:1196–203. 10.1038/s41592-021-01252-x [DOI] [PMC free article] [PubMed] [Google Scholar]
- 37. Li X, Li Z, Zhou Het al. Dynamic incorporation of multiple in silico functional annotations empowers rare variant association analysis of large whole-genome sequencing studies at scale. Nat Genet 2020;52:969–83. 10.1038/s41588-020-0676-4 [DOI] [PMC free article] [PubMed] [Google Scholar]
- 38. Trevino AE, Muller F, Andersen Jet al. Chromatin and gene-regulatory dynamics of the developing human cerebral cortex at single-cell resolution. Cell 2021;184:5053–5069.e23. 10.1016/j.cell.2021.07.039 [DOI] [PubMed] [Google Scholar]
- 39. Ziffra RS, Kim CN, Ross JMet al. Single-cell epigenomics reveals mechanisms of human cortical development. Nature 2021;598:205–13. 10.1038/s41586-021-03209-8 [DOI] [PMC free article] [PubMed] [Google Scholar]
- 40. Mannens CCA, Hu L, Lönnerberg Pet al. Dynamics of chromatin accessibility during human first-trimester neurodevelopment. bioRxiv 2023; 2023.08.18.553878. 10.1101/2023.08.18.553878 [DOI] [PubMed] [Google Scholar]
- 41. Darbandi SF, An J-Y, Lim Ket al. Autism-associated transcriptional regulators target shared loci proximal to brain-expressed genes. Cell Rep 2024;43:114329. 10.1016/j.celrep.2024.114329 [DOI] [PMC free article] [PubMed] [Google Scholar]
- 42. Short PJ, McRae JF, Gallone Get al. De novo mutations in regulatory elements in neurodevelopmental disorders. Nature 2018;555:611–6. 10.1038/nature25983 [DOI] [PMC free article] [PubMed] [Google Scholar]
- 43. Turner TN, Coe BP, Dickel DEet al. Genomic patterns of de novo mutation in simplex autism. Cell 2017;171:710–722.e12. 10.1016/j.cell.2017.08.047 [DOI] [PMC free article] [PubMed] [Google Scholar]
- 44. Turner TN, Hormozdiari F, Duyzend MHet al. Genome sequencing of autism-affected families reveals disruption of putative noncoding regulatory DNA. Am J Hum Genet 2016;98:58–74. 10.1016/j.ajhg.2015.11.023 [DOI] [PMC free article] [PubMed] [Google Scholar]
- 45. Guo H, Zhang Q, Dai Ret al. NCKAP1 disruptive variants lead to a neurodevelopmental disorder with core features of autism. Am J Hum Genet 2020;107:963–76. 10.1016/j.ajhg.2020.10.002 [DOI] [PMC free article] [PubMed] [Google Scholar]
- 46. Fu JM, Satterstrom FK, Peng Met al. Rare coding variation provides insight into the genetic architecture and phenotypic context of autism. Nat Genet 2022;54:1320–31. 10.1038/s41588-022-01104-0 [DOI] [PMC free article] [PubMed] [Google Scholar]
- 47. Nativio R, Lan Y, Donahue Get al. An integrated multi-omics approach identifies epigenetic alterations associated with Alzheimer's disease. Nat Genet 2020;52:1024–35. 10.1038/s41588-020-0696-0 [DOI] [PMC free article] [PubMed] [Google Scholar]
- 48. Mathys H, Peng Z, Boix CAet al. Single-cell atlas reveals correlates of high cognitive function, dementia, and resilience to Alzheimer's disease pathology. Cell 2023;186:4365–4385.e27. 10.1016/j.cell.2023.08.039 [DOI] [PMC free article] [PubMed] [Google Scholar]
- 49. Kempuraj D, Thangavel R, Natteru PAet al. Neuroinflammation induces neurodegeneration. J Neurol Neurosurg Spine 2016;1:1003. [PMC free article] [PubMed] [Google Scholar]
- 50. Baloni P, Arnold M, Buitrago Let al. Multi-omic analyses characterize the ceramide/sphingomyelin pathway as a therapeutic target in Alzheimer’s disease. Commun Biol 2022;5:1074. 10.1038/s42003-022-04011-6 [DOI] [PMC free article] [PubMed] [Google Scholar]
- 51. Stoffel W, Jenke B, Schmidt-Soltau Iet al. SMPD3 deficiency perturbs neuronal proteostasis and causes progressive cognitive impairment. Cell Death Dis 2018;9:507. 10.1038/s41419-018-0560-7 [DOI] [PMC free article] [PubMed] [Google Scholar]
- 52. Asai H, Ikezu S, Tsunoda Set al. Depletion of microglia and inhibition of exosome synthesis halt tau propagation. Nat Neurosci 2015;18:1584–93. 10.1038/nn.4132 [DOI] [PMC free article] [PubMed] [Google Scholar]
- 53. Hamilton LK, Moquin-Beaudry G, Mangahas CLet al. Stearoyl-CoA desaturase inhibition reverses immune, synaptic and cognitive impairments in an Alzheimer’s disease mouse model. Nat Commun 2022;13:2061. 10.1038/s41467-022-29506-y [DOI] [PMC free article] [PubMed] [Google Scholar]
- 54. Roadmap Epigenomics C, Kundaje A, Meuleman Wet al. Integrative analysis of 111 reference human epigenomes. Nature 2015;518:317–30. 10.1038/nature14248 [DOI] [PMC free article] [PubMed] [Google Scholar]
- 55. Visel A, Minovitsky S, Dubchak Iet al. VISTA enhancer browser--a database of tissue-specific human enhancers. Nucleic Acids Res 2007;35:D88–92. 10.1093/nar/gkl822. [DOI] [PMC free article] [PubMed] [Google Scholar]
- 56. Bellenguez C, Kucukali F, Jansen IEet al. New insights into the genetic etiology of Alzheimer’s disease and related dementias. Nat Genet 2022;54:412–36. 10.1038/s41588-022-01024-z [DOI] [PMC free article] [PubMed] [Google Scholar]
- 57. Jansen IE, Savage JE, Watanabe Ket al. Genome-wide meta-analysis identifies new loci and functional pathways influencing Alzheimer’s disease risk. Nat Genet 2019;51:404–13. 10.1038/s41588-018-0311-9 [DOI] [PMC free article] [PubMed] [Google Scholar]
- 58. Kunkle BW, Grenier-Boley B, Sims Ret al. Genetic meta-analysis of diagnosed Alzheimer's disease identifies new risk loci and implicates Abeta, tau, immunity and lipid processing. Nat Genet 2019;51:414–30. 10.1038/s41588-019-0358-2 [DOI] [PMC free article] [PubMed] [Google Scholar]
- 59. Kim Y, Jeong M, Koh IGet al. Category-wide association study (CWAS) package. Zenodo 2024. https://doi.org/ 10.5281/zenodo.8409105 [DOI]
- 60. Kim Y, Jeong M, Koh IGet al. Generation of annotation dataset and burden test results of category-wide association study (CWAS). Zenodo 2024. https://doi.org/ 10.5281/zenodo.11240547 [DOI]
Associated Data
This section collects any data citations, data availability statements, or supplementary materials included in this article.
Data Citations
- Kim Y, Jeong M, Koh IGet al. Category-wide association study (CWAS) package. Zenodo 2024. https://doi.org/ 10.5281/zenodo.8409105 [DOI]
- Kim Y, Jeong M, Koh IGet al. Generation of annotation dataset and burden test results of category-wide association study (CWAS). Zenodo 2024. https://doi.org/ 10.5281/zenodo.11240547 [DOI]
Supplementary Materials
Data Availability Statement
The source code of CWAS-Plus is available via a GitHub repository (https://github.com/joonan-lab/cwas/) and Zenodo (https://doi.org/10.5281/zenodo.10795678) [59], with a user manual (https://cwas-plus.readthedocs.io/en/latest/). Both repositories are released under the MIT license. The scripts to produce the annotation dataset, along with the burden test results from the CWAS analyses conducted in this study, are available via Zenodo (https://doi.org/10.5281/zenodo.11240547) [60]. The Zenodo repository is released under the Creative Commons Attribution 4.0 International license. CWAS-Plus is written in Python (version 3.9), and is easy to install and use on Linux or Mac OS.
De novo variants were obtained from the pVCF file, accessible with approval from the Simons Foundation Autism Research Initiative (SFARI Base; https://sfari.org/resources/sfari-base). ROSMAP WGS data can be requested at the AD Knowledge Portal under accession code syn10901595 (https://www.synapse.org/#!Synapse:syn10901595; see https://adknowledgeportal.synapse.org/Data%20Access for data access instructions).