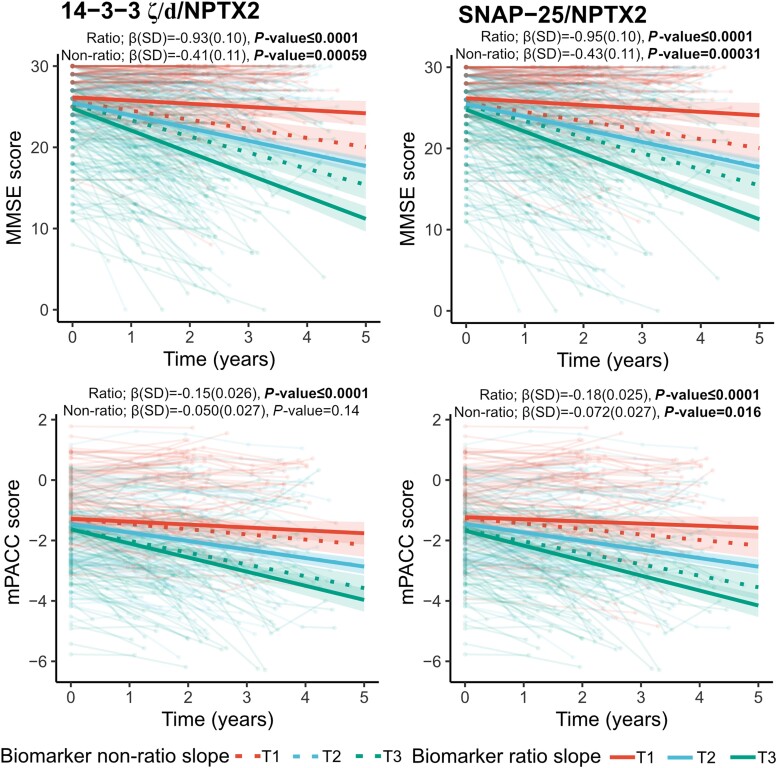
Figure 6.
Associations with cognitive measures (MMSE and mPACC scores) for SNAP-25/NPTX2 and 14-3-3 zeta/delta (ζ/d)/NPTX2 across the Alzheimer’s disease continuum. Associations of cognition (MMSE and mPACC scores) longitudinally with individual biomarkers (standardized concentrations) were examined using linear mixed-effects models (with random slopes and intercept), respectively, that included age, sex, diagnosis and years of education as covariates across the Alzheimer’s disease (AD) continuum (preclinical AD, prodromal AD and AD dementia). Dotted lines indicate the biomarker's original (non-ratio) associations. False rate discovery correction was performed for multiple comparisons. Only participants with longitudinal data were kept for the linear mixed-effect models. For longitudinal MMSE, 1069 data points from 336 participants were included, with an average of 2.61 (0.94 SD) years of follow-up. For longitudinal mPACC, 738 data points from 242 participants were included, with an average of 2.66 (0.98 SD) years of follow-up. Statistical models were performed with continuous values for the synaptic protein, and tertiles were created only for visualization purposes. MMSE = Mini-Mental State Examination; mPACC = modified Preclinical Alzheimer's Cognitive Composite; SD = standard deviation.

