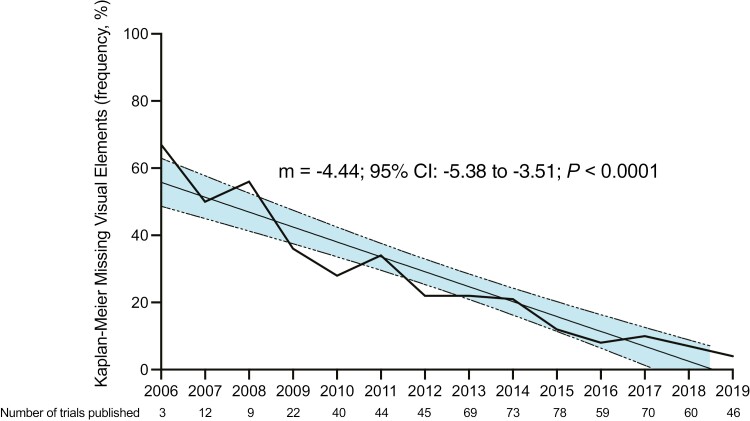
Figure 2.
Trends in phase III oncology trials with missing visual elements in Kaplan-Meier plots over time. The linear regression over time is shown with the shaded regions representing the 95% CI of the slope. Because of the small number of trials analyzed in this dataset published in the years prior to 2006 (N = 5) or after 2019 (N = 6), data prior to 2006 or after 2019 were excluded from the graph.

