. 2024 Jul 5;14(30):21277–21291. doi: 10.1039/d4ra02309a

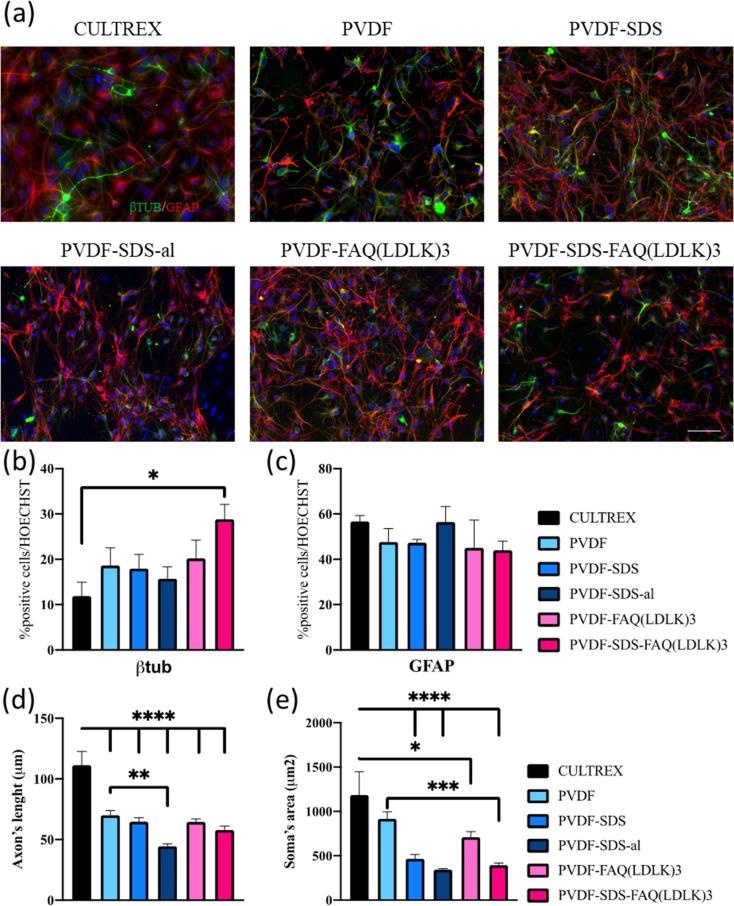
Fig. 7. (a) Fluorescence microscopic images were captured of NSCs on PVDF mats, as well as on Cultrex (control), at the conclusion of the 7 days differentiation period. β-Tubulin (βIII-TUB) was stained in green, glial fibrillary acidic protein (GFAP) in red, and cell nuclei in blue. (b) Percentages of βIII-TUB cells. (c) Percentages of GFAP-positive cells. d) Axon's length is expressed in μm. (e) Soma's area is expressed in μm2. Scale bar presents 50 μm. Statistical analysis: one-way ANOVA followed by Tukey multiple comparison test. Statistical analysis shows significant differences between conditions (*p ≤ 0.05, **p ≤ 0.01, and ***p ≤ 0.001).

Fig. 7