
Figure 6.
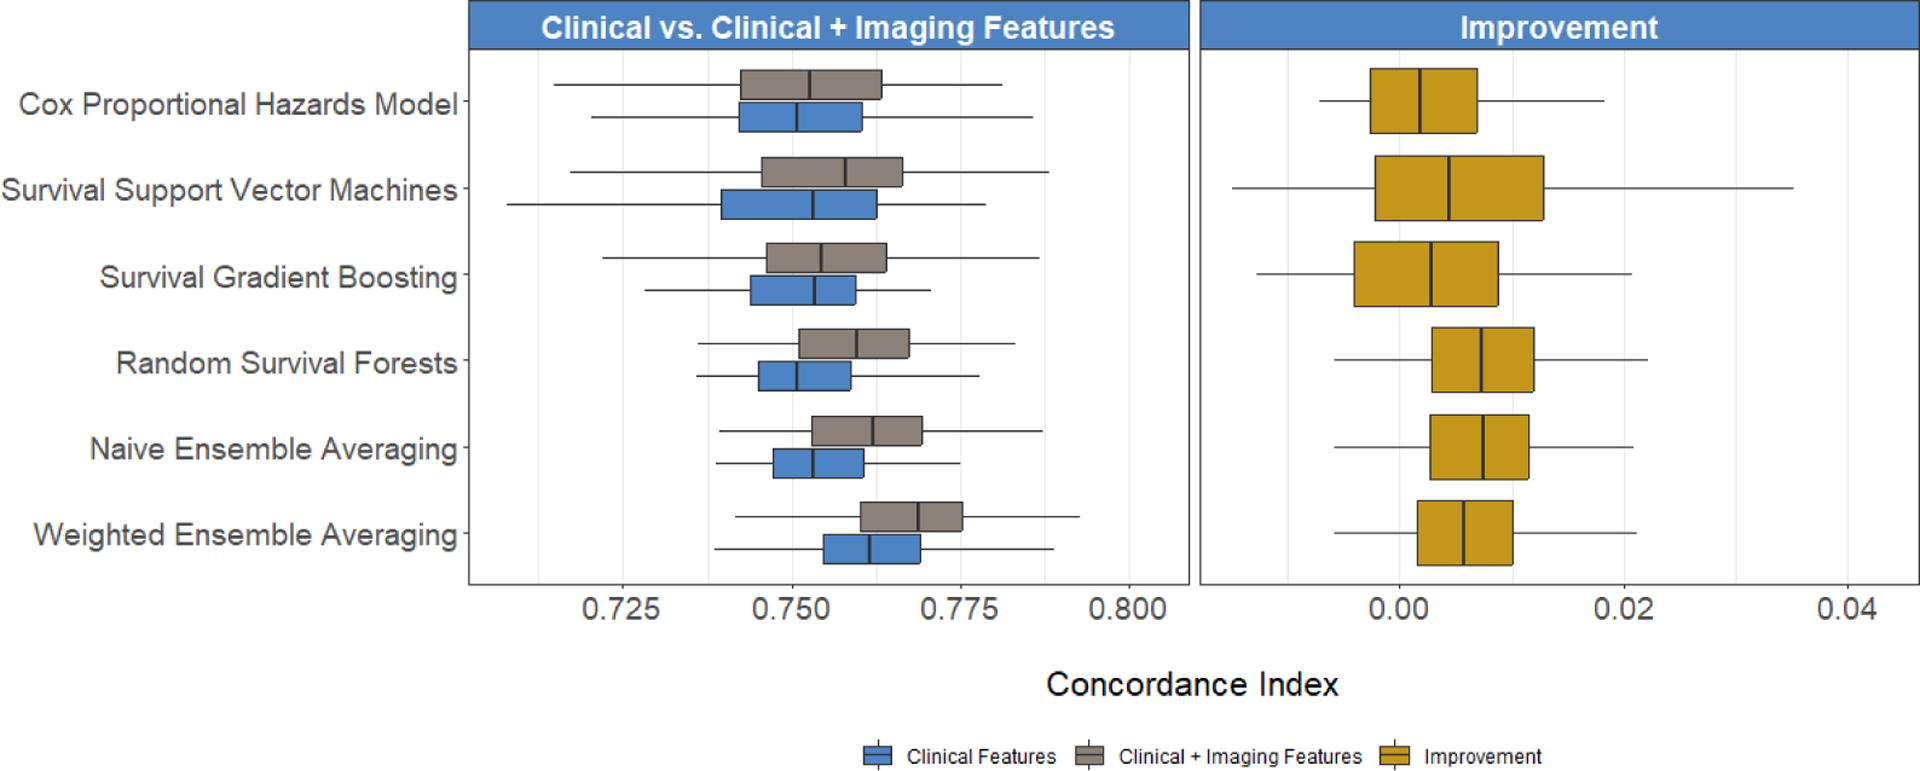
Comparisons of C-index when using clinical and clinical + imaging-derived risk factors, obtained by six machine learning algorithms. Boxplots report the distribution of the C-index across 100 training and testing experiments for the clinical versus clinical + imaging models (left) and the distribution of improvement in the C-index (right).