
Figure 8.
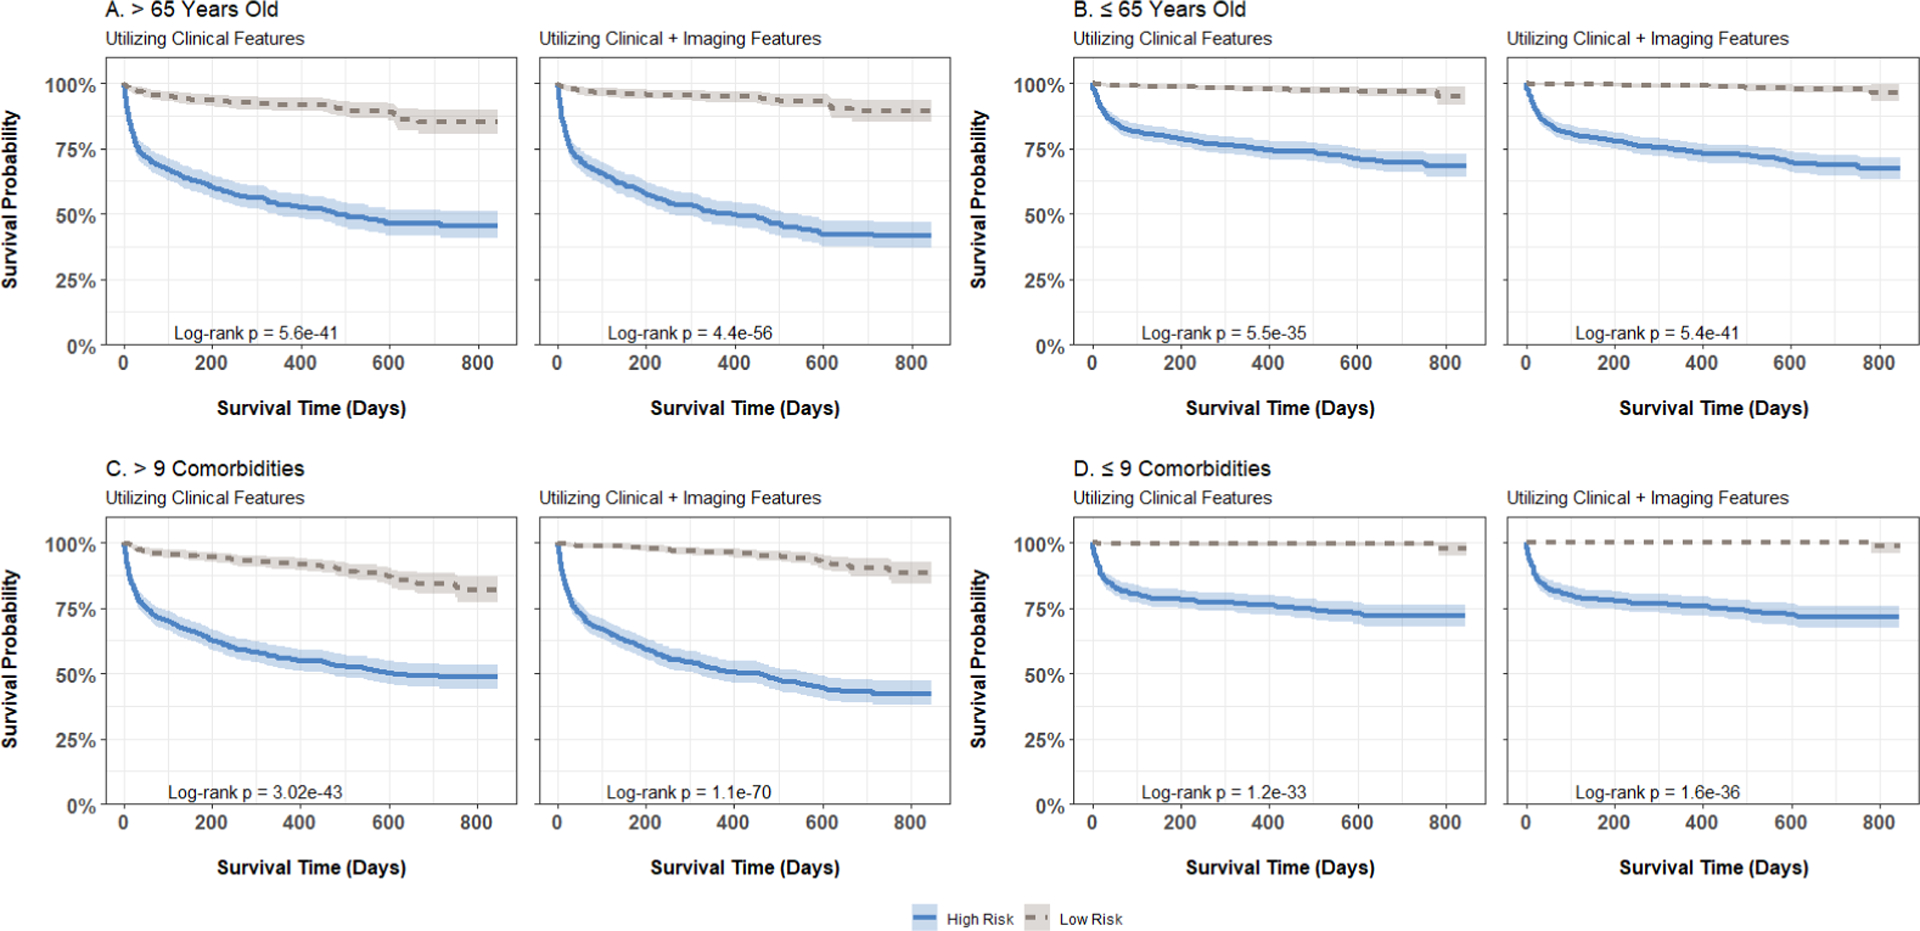
Kaplan-Meier curves for post-ICU escalation mortality, stratified by patient age and risk group (defined by median risk score), computed using weighted ensemble averaging models incorporating clinical or clinical plus imaging features within each age and comorbidity burden category: (A) age > 65, (b) age ≤ 65, (c) comorbidities > 9, (d) comorbidities ≤ 9. High-risk groups are represented by solid lines, while low-risk groups are depicted with dashed lines.